
Were the January housing figures really that bad? Pete Wargent

The financial media had an arousing day extrapolating the January Housing Finance figures.
Although I didn't have time to read all of the articles, the headlines variously describing these data as confirming a housing downturn, a fall, a cooling, a sinking, and for reasons that weren't entirely clear, even "home loans dropping at their fastest rate in 7 years"!
In actual fact, home loan activity hit its highest level in 7 years last month, while the investor sector has slowed.
Whatevs, it's fairly typical for total dwelling finance to decline by 20 to 30 percent in January as Aussies focus on the beach or their Christmas turkey, so there is obviously a fair bit of reliance on how accurate or otherwise the seasonal adjustments prove to be.
Such data series tend to jump around a bit from month to month, so the important thing to do is follow the trend, and to observe the data in conjunction with other metrics.
The US nonfarm payroll figures represent a fine case in point, with a decline in average earnings of 3 cents in February variously intimated to be one of the biggest falls since Niagara, despite the fact that earnings had increased by 12 cents only in January.
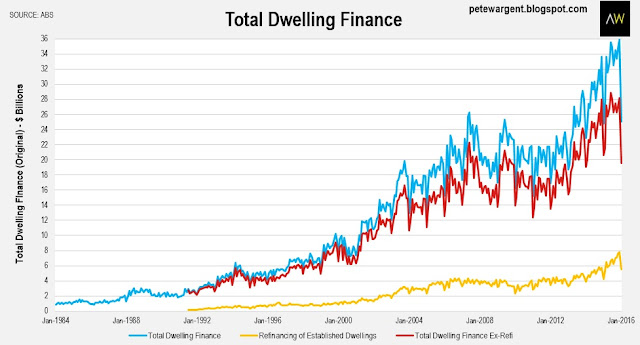
Back to the housing figures, the original data showed total dwelling finance of $25 billion, which was only slightly higher than the total for the preceding January, underscoring the dampening of investor activity.
That said, the chart of original data below may simply be mimicking what happened to CoreLogic-RP Data's mortgage index, which observed platform events declining sharply for the same period before recovering strongly in more recent weeks.
The most obvious explanation for the pullback is that the crackdown on investor finance has run interference on the pace of lending to that sector, as lenders continue to apply more rigorous criteria.
Certainly I've come across numerous examples of stymied demand relating to would-be investors who are needing to try several avenues in order to secure finance, and many are having to wait to secure loans (for example, needing time to save larger deposits, or to prove higher levels of serviceability).
With interest rate settings as low as they are, there is evidently an enormous pent up demand for investment loans, but APRA has quite sensibly decided not to let the investor sector get any further ahead of itself.
There is litte such weakness to be found in the owner-occupier lending sector, with the value of commitments in January well up on last year, and some +42.3 percent higher than the equivalent figure for January 2012.
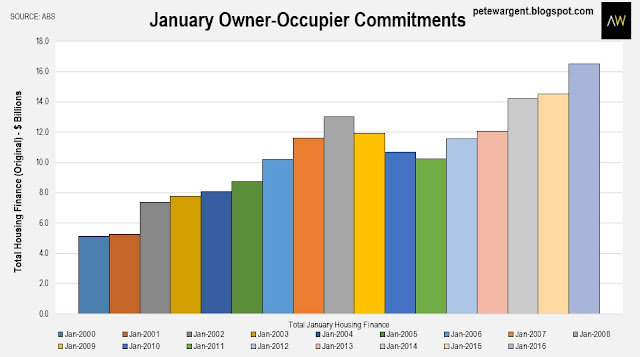
There has been a high volume of refinancing in recent weeks, which muddies the macro picture somewhat.
Construction boom set to peak
The residential construction boom and its associated multiplier effect still has legs, but in reality the industry is already going like the clappers in Sydney and some other cities, to the extent that labour costs have spiked to reflect an industry operating at close to its full capacity.
This dynamic cannot continue in perpetuity - nor should it - and the downturn in the residential construction sector will likely begin to reveal itself at some point later in the calendar year.
While the data charted below are only indicative rather than definitive, they do appear to support the notion of an imminent peak.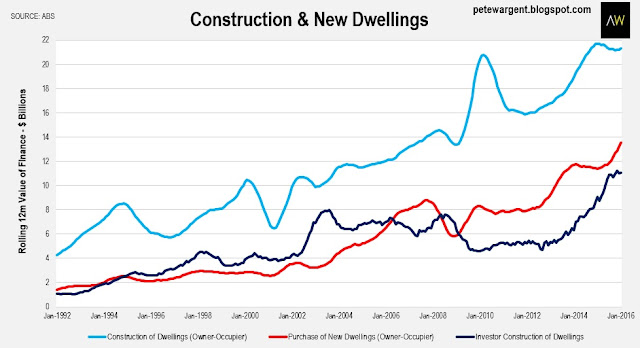
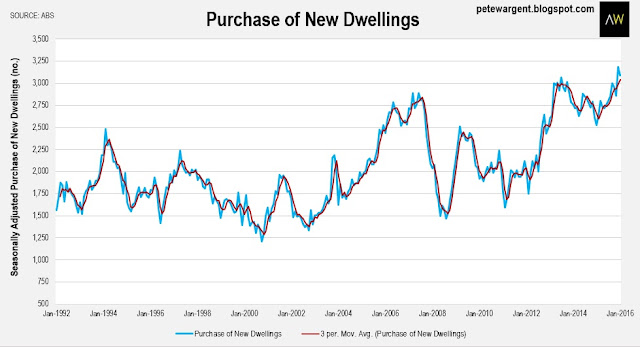
Similarly the number of new dwellings financed is tracking at a historically high level, but also looks peaky.
First timers & renovations
First homebuyers accounted for only an estimated 15.1 percent of dwellings financed in January which is below the long run average, though the Australian Bureau of Statistics does note that this figure is only an estimate since some lenders are not yet reporting correctly.
Although conventional wisdom is that first homebuyers are inactive being priced out of the market, comprehensive surveys carried out by Digital Finance Analytics (DFA) have shown that many are opting to get onto the housing ladder as investors, as those of us active in the market are only too aware.
Actual first time buyer purchases have been tracking at around 13,000 per month in line with the long run average, with DFA surveys finding that many are using the "bank of Mum and Dad" (and some fortunate souls are buying for cash, thereby escaping being captured by the housing finance data entirely).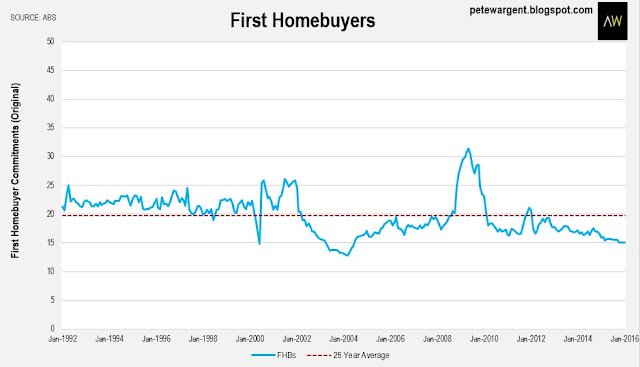
Finally, it has taken a heck of a long time to get things moving but major renovations activity is at last picking up as households enjoy the wealth effect of cheaper mortgage repayments and rising dwelling prices.
Sydney clearly leads the way in terms of renovation activity as one would expect. Outstanding research once gain by CoreLogic-RP Data featured on yesterday's national news showed that 18 of the top 20 suburbs with the highest percentage of home equity are unsurprisingly located in Sydney. The other two are in Melbourne.
The 20 suburbs and towns with the most depressed levels of home equity read like a list of yesterday's regional property hotspots, including but not limited to: Moranbah, Gladstone, Mackay, Whitsundays, Bundaberg, Mount Isa, Rockhampton, Whyalla, Greater Geraldton, and Muswellbrook.
Just as in regional New Zealand, the commodities crash has hit much of regional Australia hard.
Interestingly, we are presently in the midst of a commodity price mini-boom with oil prices rebounding and iron ore futures again hitting "limit up" during today's trade to hit their highest level since July 2015.
While this is potentially a welcome windfall for the budget, don't be headfaked by it - the resources construction collapse still has a long, long way to run, and the deleterious impacts will be felt across many regions for years to come.
The wrap
Overall, it would be premature extrapolation to read too much in the January figures, even though the trend certainly points towards a considerably lower level of investor activity in 2016 than was the case at the mid-2015 peak.
As always, it also pays to recognise that there is one singular "housing market", since some markets are performing very strongly, helping to offset the poor perfomance in many resources regions.
News of a downturn would certainly be news to residents of Kingsford in Sydney, where an unrenovated dump on a 499.5 square metre plot sold for a an outrageous $3,065,000 on Saturday (this was more than $1 million over the reserve price, and note the price guide!), having previously fetched $1,015,000 back in March 2008, when many commentators were predicting a price correction.
Surry Hills, an inner Sydney suburb with a vacancy rate of just 1.1 per cent, has recorded a series of sprightly results, and doubtless there are plenty of other examples in the inner suburbs of Sydney. House prices in Brisbane are also rising, as I noted yesterday.
PETE WARGENT is the co-founder of AllenWargent property buyers (London, Sydney) and a best-selling author and blogger.
His latest book is Four Green Houses and a Red Hotel.

