
NSW dwelling stock value explodes: Pete Wargent

The wealth effect from a multi-year Sydney property market boom has sent trend retail turnover, new motor vehicle sales, building activity and total employment in the Premier State surging to new highs in recent months.
It's not hard to see why.
Over the three years to June 2015 the value of residential dwelling stock in the state has flamed up by nearly three quarters of a trillion dollars - massively boosting net household wealth in the process - and in turn leading to increased employment in the residential construction sector together with its associated multiplier effect.
The latest data from the ABS showed that the total value of residential dwelling stock in New South Wales has exploded by +$737 billion to nearly $2.3 trillion over the three years since March 2012.
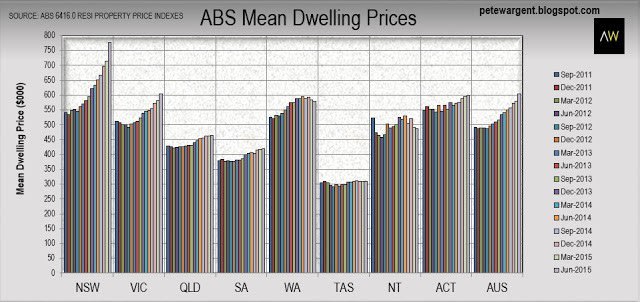
However, increases in the value of dwelling stock have been by no means uniform across Australia as you can see in the first chart below.
Over the three years to June 2015 the value of residential dwelling stock in the state has flamed up by nearly three quarters of a trillion dollars - massively boosting net household wealth in the process - and in turn leading to increased employment in the residential construction sector together with its associated multiplier effect.
The latest data from the ABS showed that the total value of residential dwelling stock in New South Wales has exploded by +$737 billion to nearly $2.3 trillion over the three years since March 2012.
However, increases in the value of dwelling stock have been by no means uniform across Australia as you can see in the first chart below.
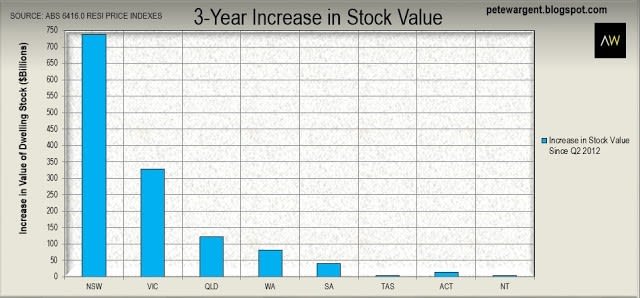
Indeed, while Victoria (+$327 billion) and Queensland (+$123 billion) have recorded some solid gains over the last three years - which have contributed to the combined value of Australia's dwelling stock surpassing $5.75 trillion - the total value of stock has been declining in Western Australia and the Northern Territory for the past year.
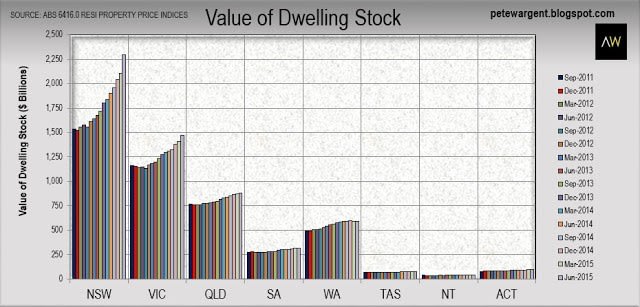
Over the June 2015 quarter New South Wales (+$193 billion) and Victoria (+$65 billion) accounted for 95 per cent of the +$272 billion uplift in the total value of Australia's residential dwelling stock.
Note that although the ABS data series is not the most timely indicator, with the benefit of additional time to collate results it is likely to be the most accurate.
Note that although the ABS data series is not the most timely indicator, with the benefit of additional time to collate results it is likely to be the most accurate.
Residential indexes
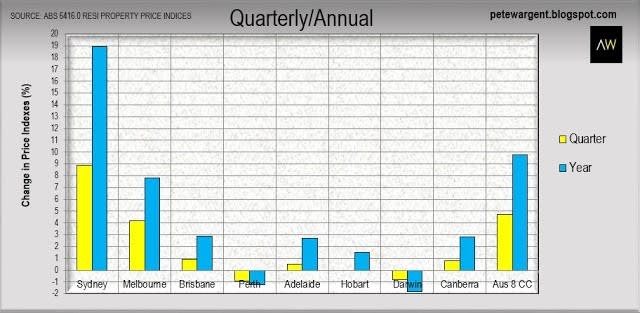
The latest figures released today by the ABS to Q2 2015 recorded an extraordinary boom in Sydney dwelling prices with prices exploding +8.9 per cent higher in the June quarter to be +18.9 per cent higher over the year.
Sydney has not seen quarterly gains of this magnitude for nearly three decades in percentage terms.
Sydney has not seen quarterly gains of this magnitude for nearly three decades in percentage terms.
Solid gains for the quarter were also recorded in Melbourne (+4.2 per cent), Brisbane (+0.9 per cent) and Canberra (+0.8 per cent).
Elsewhere index moves for the quarter were subdued, or negative in the cases of Perth (-0.9 per cent) and Darwin (-0.8 per cent).
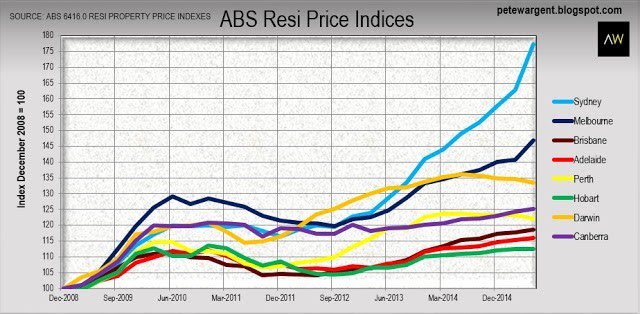
Since Q4 2008 Sydney's accelerating dwelling prices have blown up the index to be +77.3 per cent higher, with Melbourne a distant second at +46.8 per cent.
At the bottom end of the scale come the southern state capitals of Hobart (+12.6 per cent) and Adelaide (+15.9 per cent).
At the bottom end of the scale come the southern state capitals of Hobart (+12.6 per cent) and Adelaide (+15.9 per cent).
The mean price of a residential dwelling as at June 2015 increased to $604,700 in Australia having jumped by some $26,200 in the quarter, with those gains having been overwhelmingly driven by Sydney (+$63,400 to $777,400) and Melbourne (+$24,300 to $605,000).
Established houses outperform
Supply response
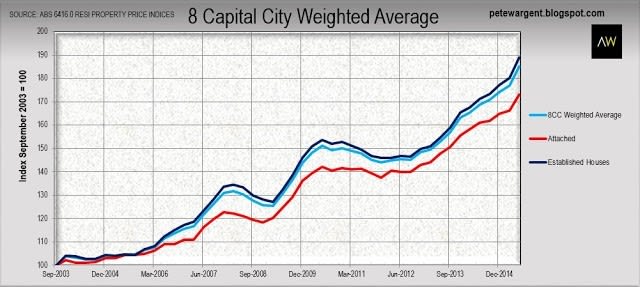
ABS data now exists back to September 2003 which allows us to compare the relative performance of established houses versus attached dwellings.
As you can see below, on average established houses (+89 per cent since Q3 2003) have outperformed attached dwellings (+73 per cent) over the past dozen years.
These figures equate to compounding annual price growth of +5.4 per cent for established houses and +4.6 per cent for attached dwellings since Q3 2003.
Of course, averages mask any number of sub-trends, and it is also true that initial rental yields on townhouses, units and apartments can often be at least 1 per cent higher than those achievable from established houses in equivalent locations.
It may also be the case that going forward attached dwellings might perform comparatively well in the denser capital cities where the affordability of established housing is becoming increasingly prohibitive.
It may also be the case that going forward attached dwellings might perform comparatively well in the denser capital cities where the affordability of established housing is becoming increasingly prohibitive.
Nevertheless, the above chart does hint towards land value and scarcity value as being two of the key underlying drivers of dwelling price growth.
Supply response
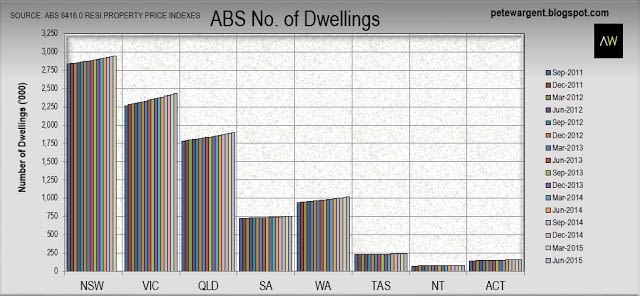
The preliminary figures for Q2 2015 recorded an estimated 9,528,300 dwellings in Australia, a reasonably solid increase of +38,400 dwellings for the June quarter and +161,500 for the past year.
Unfortunately the ABS could provide no preliminary estimate for the number of New South Wales dwellings this quarter.
Using projections of historic data it seems likely that assuming the data is accurate the total stock of dwellings in the Premier State has increased by close to ~120,000 units since September 2011, with the population of the state having increased by an estimated ~375,000 over the same time horizon.
In other words, despite an uplift in both home starts and dwelling completions since FY2012, New South Wales evidently has some way to go before the market becomes saturated with new builds.
It was announced this week that the New South Wales Government will release some 7,700 hectares of land for the construction of up to 35.000 new homes to the south of Campbelltown.
It is dubious, however, just how much impact newly constructed dwellings located 70 kilometres from the centre of Sydney will have on established dwellings in the inner suburban market given the poor level of substitutability with fringe housing.
PETE WARGENT is the co-founder of AllenWargent property buyers (London, Sydney) and a best-selling author and blogger.
His latest book is Four Green Houses and a Red Hotel.
Pete Wargent
Pete Wargent is the co-founder of BuyersBuyers.com.au, offering affordable homebuying assistance to all Australians, and a best-selling author and blogger.

