
Regional land prices are falling: Pete Wargent

A stunning research note from Cameron Kusher of CoreLogic-RP Data which revealed that while median vacant land prices continued to rise very strongly in Australian capital cities over the past year, regional land prices fell by -3.4% to $156,500.
In particular land values in Sydney (+16.6%) and Melbourne (+14.5%) have exploded over the past year.
And while demand for housing is presently low in Western Australia, median land prices in Perth continued to escalate very significantly (+10.3%), which in turn will force up the cost of new housing. Today, Sydney and Perth have the most expensive land prices in Australia.
Unlike in the capital cities regional lot sizes have actually expanded by +8.3% over the past year according to Kusher, making the decline in median land prices all the more notable.
Driven by rapid expansion in household debt regional property prices had a relatively strong run in the lead up to the financial crisis, but this trend has evidently now slowed.
While a 750sqm lot in a capital city 25 years ago would have cost you $50,000 according to Kusher, today it would set you back $417,800...and rising.
While a 750sqm lot in a capital city 25 years ago would have cost you $50,000 according to Kusher, today it would set you back $417,800...and rising.
Regional land values are therefore reportedly some 39% cheaper than in the capital cities, the largest such differential in since 1990.
Interestingly over the long haul land prices have appreciated at a very similar percentage annual rate between capital cities and the regions.
This implies in turn that the best performing property types have been those with a high percentage land value.
More remote properties - where the land component comprises only a small part of the asset value - remain cheap precisely because the value is all in the building, and not the land.
"Location, location, location" as the old mantra goes.
Why is this happening?
Why are regional prices not keeping pace? And particularly why has this become the case now?
This is a complex question, but a major reason for the strength in capital city land values is likely to be the restricted supply of new land made available for development in the congested capital cities where population growth and therefore underlying demand is strong.
Regional population growth has been considerably weaker ex-Queensland, and there is generally speaking more land available for development.
Since the financial crisis there has been another key driver for the larger capitals: jobs growth.
The ABS released its Detailed Labour Force figures for August 2015 today which underscored some important trends.
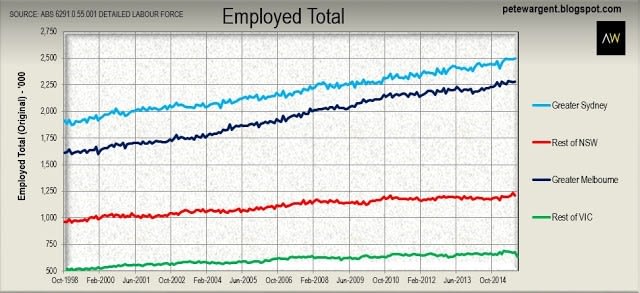
Cities creating jobs
While regional employment in the two most populous states was growing reasonably robustly until the financial crisis, regional employment growth has now slowed, with the mining capex cliff now adding to the drag in some regions.
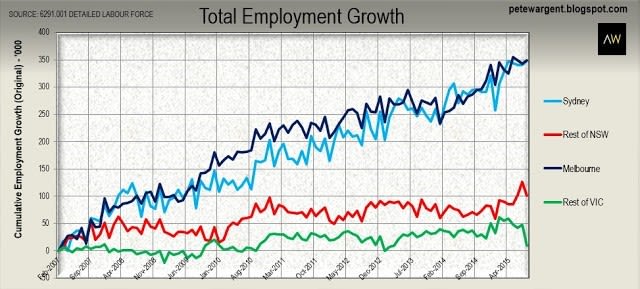
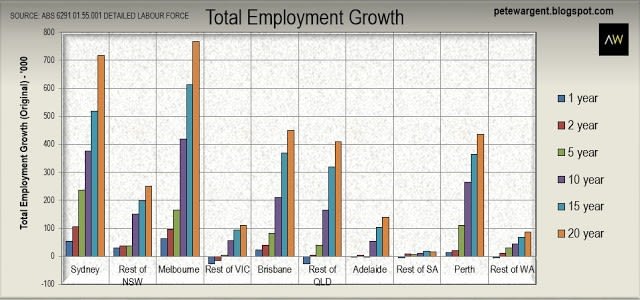
Looking below at cumulative employment growth since Febuary 2007, we can see why both Sydney and Melbourne have been labelled by the Reserve Bank as "self-sustaining job magnets", creating +350,000 new jobs apiece.
The combined cities and towns of regional New South Wales has created a fair level of new employment (+100,000), particularly in the Hunter, Newcastle and the Illawarra.
However, over the same time period regional Victoria has by comparison created almost no additional employment (+10,000) on a net basis.
An unfortunate corrollary of this is while there was always a level of frictional unemployment in the lead up to 2007, there had at times been a job for almost everyone who wanted one.
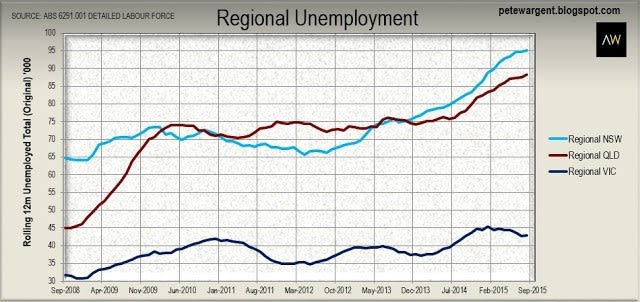
Sadly this is no longer the case, and regional unemployment in particular has been pulsing higher.
Employment growth
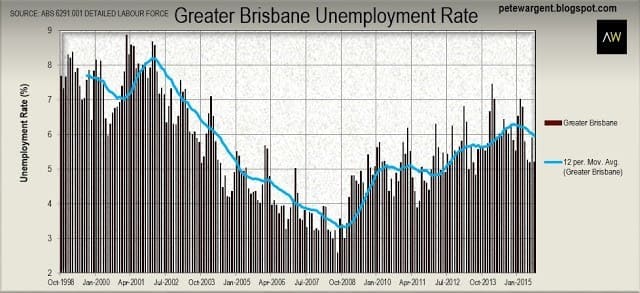
Not dissimilarly while Greater Brisbane has now added +23,000 jobs over the year to August 2015, regional Queensland employment has declined by -27,000, though there may be some debate over the "quality" of new jobs created.
While some revisions have been made to population assumptions relating to Western Australia, total employment in Perth has continued to rise modestly.
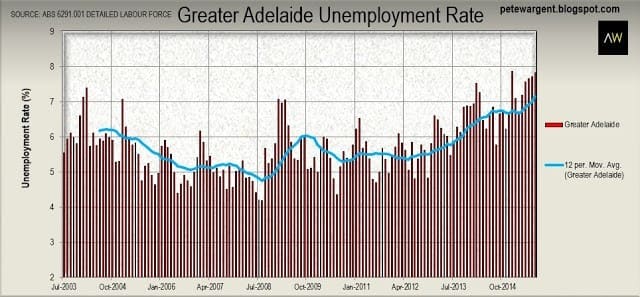
Unfortunately total employment in Adelaide has declined over the past five years (-2,700), with more challenges in the pipeline in the manufacturing space and rising unemployment.
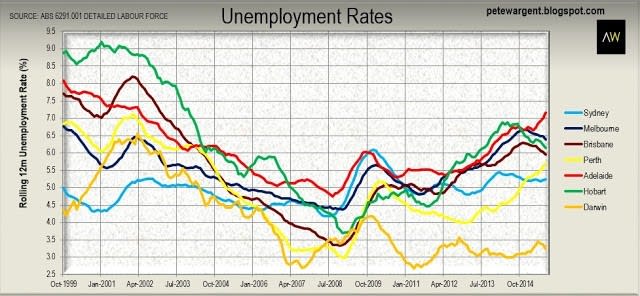
Unemployment rates
On the other hand, unemployment is clearly rising in Perth and Adelaide.
Smoothing the volatile monthly unemployment readings below on a rolling annual basis we can see that Greater Sydney remains the best placed economy, the unusual labour market of Darwin aside.
New South Wales also has the lowest level of mortgage delinquency rates according the latest figures from Moody's.
On the other hand, unemployment is clearly rising in Perth and Adelaide.
Adelaide is now recording an unemployment rate reading of 7.9 per cent which is dragging up the 12 month moving average.
On the other hand Greater Brisbane has now recorded two surprisingly low readings of just 5.2 per cent over the last three months.
Realistically the true unemployment rate in Greater Brisbane is higher than that, but nevertheless this is heartening to see for the Queensland capital.
PETE WARGENT is the co-founder of AllenWargent property buyers (London, Sydney) and a best-selling author and blogger.
His latest book is Four Green Houses and a Red Hotel.
Pete Wargent
Pete Wargent is the co-founder of BuyersBuyers.com.au, offering affordable homebuying assistance to all Australians, and a best-selling author and blogger.

