
What we can learn from the UK property 'bubble'

It gets rather tiring reading the commentary on UK house prices from people who have clearly never been here, less still have a modicum of ability to interpret data.
The latest angle has been that London prices have 'crashed' due to a monthly movement in Rightmove's asking price index.
Well, no.
For one thing, even Rightmove themselves warned that their asking price index is volatile and treated with caution, and particularly so in August historically, (not to mention that the very same index increased by well over 10% in October, which should tell you everything you need to know about its reliability on a month to month basis).
In short, we see the London market cooling back a little over the next 12 months.
Investors who want to outperform should look at a couple of our recommended suburbs including a couple of those set to benefit from the construction of the Crossrail project.
Away from London the market has never really gotten that hot post financial crisis, and in many areas is actually still very flat, with stock turnover very slow.
Anyway, back in the real world, here's the latest data from the Office for National Statistics (click chart):
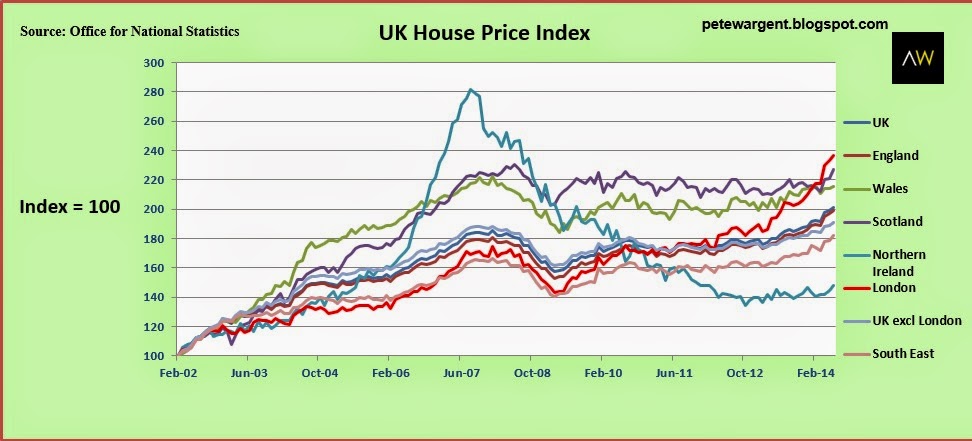
London is denoted by the red line, recording the highest growth in the nation.
Key points:
- "UK house prices increased by 10.2% in the year to June 2014, down from 10.4% in the year to May 2014.
- "House price annual inflation was 10.7% in England, 3.5% in Wales, 6.0% in Scotland and 4.9% in Northern Ireland.
- "House prices are increasing strongly across most parts of the UK, with prices in London again showing the highest growth.
- "Annual house price increases in England were driven by an annual increase in London of 19.3% and to a lesser extent increases in the South East (9.7%) and the East (7.9%).
- "Excluding London and the South East, UK house prices increased by 6.3% in the 12 months to June 2014.
- "On a seasonally adjusted basis, average house prices increased by 0.5% between May and June 2014."
Northern Ireland to reinflate a housing bubble?
The ONS data for Northern Ireland (NI) shows that its house prices are up 4.9% on a year ago raising the interesting question of whether the country will repeat any of the same mistakes of the last decade.
It seems unlikely that price will be allowed to run upwards unchecked as they were through to 2007. At the peak of the bubble in June 2007, NI house prices had increased by 55.9% in only a year before eventually reversing.
The worst year in NI was the year to June 2009 when prices fell by 23% in only 12 months, before falling further through 2010 to 2012.

Despite claims to the contrary, London is a very different proposition.
Quite apart from being a major international financial centre, with a population of more than 8.3 million the ratio of new housing stock to established in such a large city remains immaterial and thus limited in its impact on the market.
The population of Belfast by contrast is only 280,000, so a boom in levels of construction can have a marked impact on housing market economics.
Ireland experienced a perfect, self-perpetuating housing bubble storm of full employment, booming prices and massive overbuilding.
London has the opposite problem after years of woefully inadequate construction despite rapid population growth.
UK property 'bubble'
I've been back in my home city of Sheffield in Yorkshire the past couple of days.
Listening to some overseas commentary about the UK market, you'd think the property market across Britain was apparently in a bubble.
Yet surely only someone who doesn't know the meaning of the word could describe the ex-London UK housing market as a bubble.
Speculative mania? Uncontrollable credit growth?
Prices have gone absolutely nowhere for more than seven years - backwards in many cases - and this through a period when inflation has been romping along at a 5% pace at times. In real terms, prices are way down in regional markets across England.
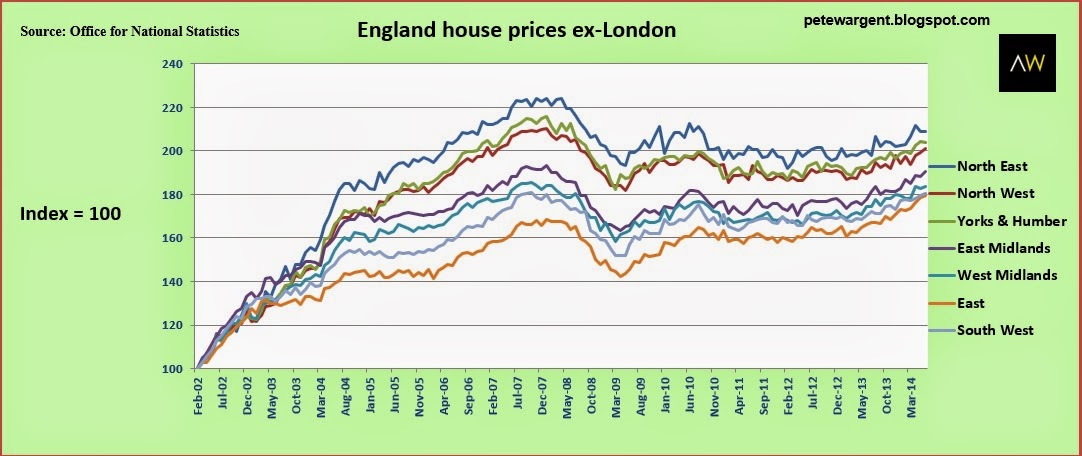
The truth of the matter is that away from London and the south-east most housing markets remain painfully slow. Much of the same housing stock which was for sale when I was over here a year ago and the year before that still remains for sale.
This is a key reason why I don't invest in regional markets. Property is an illiquid enough asset as it is without compounding matters by investing in thin markets where demand is low.
Australia will get a sharp downturn one day, and when we do illiquid, depreciating assets will prove to be very painful for some investors who want to sell.
Being back in Sheffield in northern England it has been very notable how developments like the Hallam Tower have not progressed one iota in more than 10 years, and this is a site with the most spectacular views across the city.
The Park Hill redevelopment has progressed a little over the past decade but much of it is still derelict.
A property bubble? Hardly. Britain's housing market is very much a case of London and the south-east versus the rest.
Article continues on the next page. Please click below.
Sydney property market...bazinga
We've been suggesting for a couple of years now that low interest rates will keep property investors hammering the Sydney property market, and it's certainly been the case that interest rate cuts have had a marked effect on market activity through recent cycles.
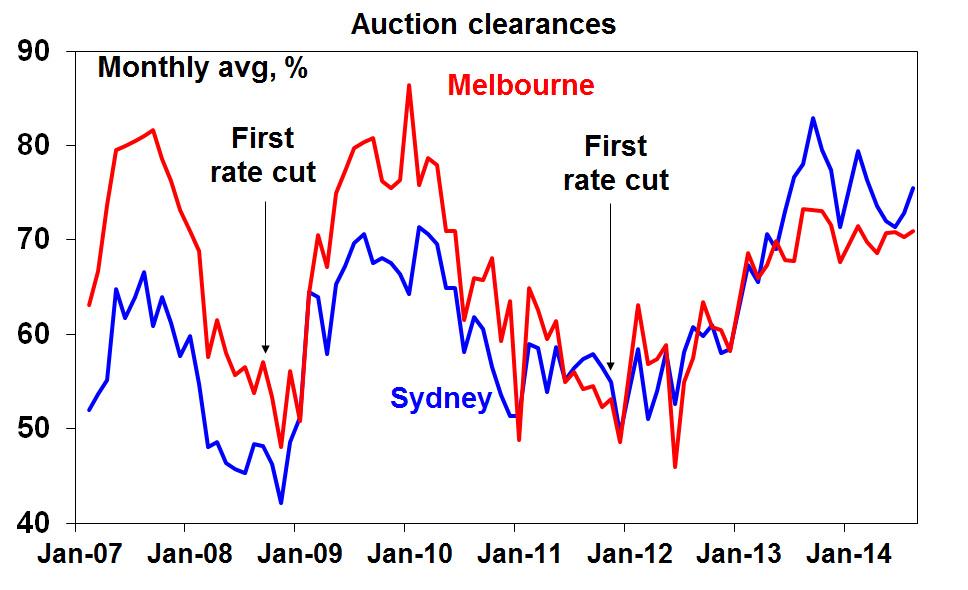
The chart below shows the correlation between the first rate cut of the most recent easing cycles and auction clearance rates.
Through September and October 2008 the official cash rate was cut from 7.25% to 6%.
And then in November 2011 the cash rate was cut to 4.50%, heralding the beginning of the latest cycle.
You can see below the reaction of Australia's major property markets.
For months commentators have been suggesting that the market is fading, but we have had to agree to disagree.
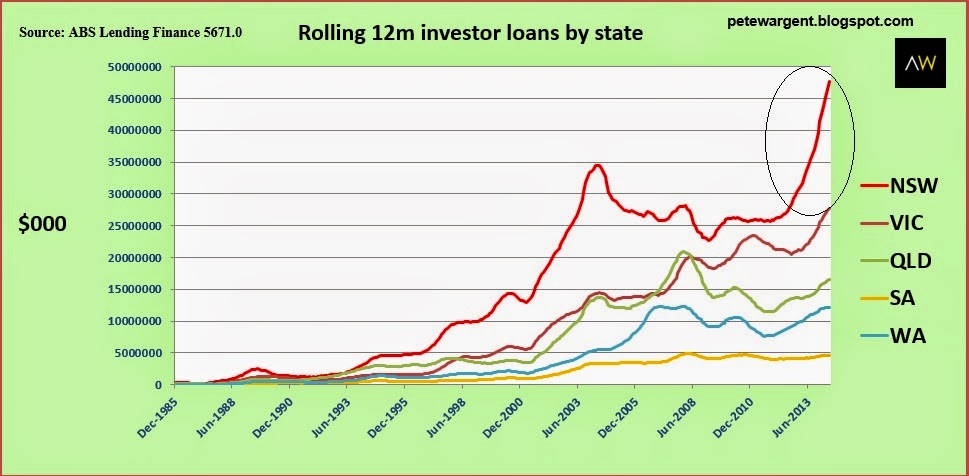
Au contraire, with the cash rate now at only 2.50%, demand from investors in particular is exceptionally strong and rising.
If you have been following the data, you will know that investor finance in New South Wales is going through the roof.
There is also a theory that investors in the Sydney market have been "pulled forward" and therefore the market has been overdue to reverse.
Perhaps yes to some extent, but in reality rising dwelling prices in Sydney have created more equity for redraw, low interest rates have led household savings higher allowing potential investors to employ more leverage...and if the Aussie dollar slides further then more foreign capital may find its way into the Sydney and Melbourne markets too.
Weekend - auctions booming
Anyways, it was an absolute rip-snorter of a weekend of auctions despite the rain.
Australian Property Monitors recorded a thumping preliminary auction clearance rate of 83.4%, with the trend over the past five weeks one of a strengthening market as we move towards spring.

Source: Australian Property Monitors.
RP Data, which typically records a lower result, came in at 75.8%.
No slowdown there. As for where the market is really firing...one of our favourite suburbs of the past five years just keeps on going, recording a perfect 100% clearance rate this weekend...

You can visit AllenWargent property buyers (London, Sydney) or Pete's blog.
His latest book is 'Four Green Houses and a Red Hotel' .