
Sydney dwelling values up 13 percent over the year while Perth remains in decline: Tim Lawless

GUEST OBSERVER
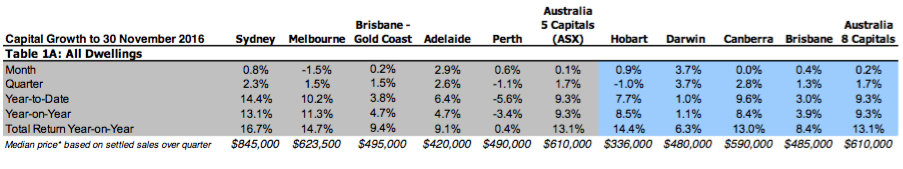
Throughout November, capital city dwelling values rose by 0.2 percent.
While the headline results remained in positive growth territory, the monthly capital gain reading was also the softest result since December 2015 when capital city dwelling values were unchanged over the month. The combined regional areas of Australia showed a weaker result with house values falling by 0.2 percent over the month.
The soft performance across the combined capital city reading was attributable to a 1.5 percent fall in the Melbourne index, while all other capital cities recorded a positive month-on-month result.
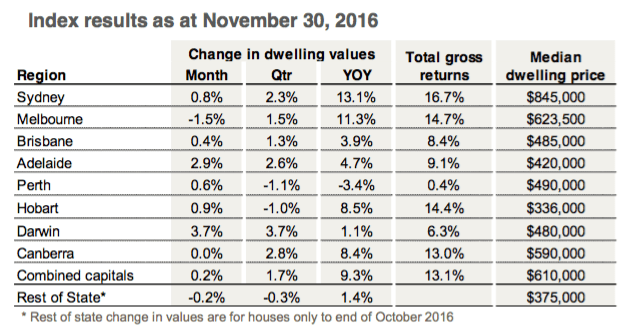
Delving into the Melbourne results in more detail showed that unit values were down a larger 3.2 percent in November, while Melbourne house values declined by 1.3 percent over the month.
The November figures show that capital city dwelling values rose by 1.7 percent over the three months of spring; a substantial improvement over last year. Spring 2015 saw capital city dwelling values fall by 0.2 percent, with auction clearance rates dipping below 60 percent in late November and early December.
In contrast, auction clearance rates held firm in the mid-70 percent range throughout spring this year, with Sydney clearance rates holding around the 80 percent mark over the past three months.
On an annual basis, every capital city except for Perth is now showing a positive annual trend in dwelling value growth. The highest annual growth rate is evident in Sydney and Melbourne where dwelling values are now 13.1 percent and 11.3 percent higher respectively, reflecting a steeper upwards trajectory in growth over the second half of the year. The Hobart and Canberra markets have also seen some acceleration in growth rate trends with dwelling values up 8.5 percent, and 8.4 percent respectively over the past twelve months.
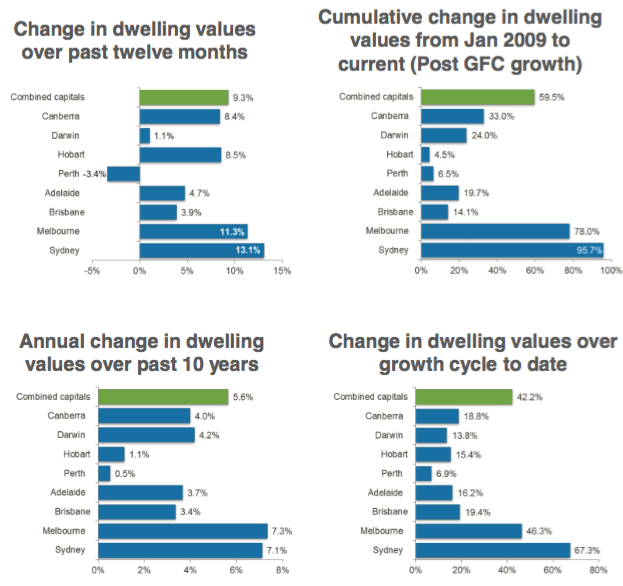
For the first time since February 2015, Darwin’s annual growth rate has moved back into the black and recorded a 1.1 percent rise in dwelling values over the past year. Results for smaller cities such as Darwin, can tend to show higher levels of volatility.
The November results also show a rise in transaction numbers across the Darwin market over recent months, supporting the moderate improvement in market conditions that the hedonic index is showing.
Currently the national growth cycle has been in play for 4.5 years, with capital city dwelling values rising by 42.2 percent over the cycle to date.
Disaggregating this growth figure highlights the diversity in market conditions with Sydney and Melbourne at one end of the spectrum experiencing an increase in dwelling values over this period of 67.3 percent and 46.3 percent respectively, while at the other end of the spectrum, Perth and Darwin values have broadly declined since 2014. Perth values are 6.9 percent higher since the cycle commenced in June 2012, while Darwin values are 13.8 percent higher over this period.
It appears that higher unit supply is progressively weighing down the capital gains across Melbourne’s unit sector, with annual capital gains tracking at 3.9 percent for Melbourne units compared with a 12.2 percent annual gain in Melbourne house values.
A similar trend can be seen in Brisbane, where the supply of units across key inner city regions is also high. Brisbane house values were up 4.3 percent over the past twelve months compared with a 0.9 percent fall in unit values.
With the unit supply pipeline remaining substantial, we expect to see a continuation of weaker market conditions across those unit markets where high supply levels are dampening the prospects for higher value growth.
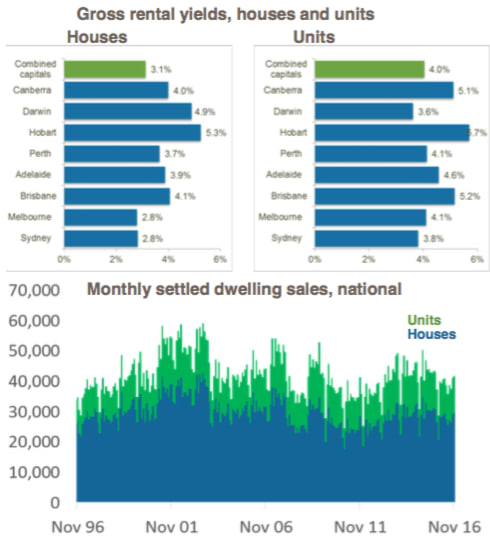
Rental yields reached a new record low in November across the combined capitals index due to dwelling values continuing to rise at a faster pace than weekly rental rates. The average gross rental yield across combined capital city dwellings is now recorded at 3.2 percent, down from 3.5 percent a year ago and 4.1 percent five years ago.
Sydney and Melbourne share the lowest yield profile for detached housing, with an average of 2.8% in both cities, while the gross yield on Sydney units has fallen well below Melbourne’s at 3.8 percent.
With rental markets remaining soft, it is likely there will be further yield compression across those markets where residential property values are rising.
The only market segments where yields have improved over the past 12 months were the Hobart and Canberra unit markets where rental rates have shown a higher growth rate than unit values.
It appears as though the low yield profile is no deterrent to investors, with ABS housing finance data showing a consistent rise in finance commitments for investment purposes since May this year.
Clearly investors are continuing to see housing as the preferred investment option, despite low yields and a mature growth cycle.
Settled transaction numbers nationally have reversed their downward trend over recent months with CoreLogic estimates of settled sales rising to the highest level in a year. Even though transaction numbers have improved, settled sales remain 9.6 percent lower than a year ago. Every state and territory has shown a reduction in settled sales over the year, however the largest fall has been in Victoria with a 14.9 percent year-on-year decline. In contrast, CoreLogic mortgage valuation platforms experienced record daily volumes earlier this week, reflecting the robust level of late season market activity.
As the last month of spring, November has seen listing numbers ramp up more substantially with the total number of homes advertised for sale over the past month now tracking higher than a year ago. The latest CoreLogic listing counts show there were approximately 113,500 properties advertised for sale over the past 28 days across the capital cities, which is 2.4 percent higher than the same time a year ago.
Despite higher listing numbers at a combined capitals level, the hottest markets are still showing listing numbers lower than a year ago. Sydney listings are 9.4 percent lower than last year, while advertised stock levels in Melbourne are 2.9 percent lower. Hobart listings have fallen sharply compared with last year, to be 29 eprcent lower, whilst Canberra stock is 7.6 percent lower than a year ago.
Lower stock levels in these markets are likely to be one factor contributing to the upwards pressure on dwelling values. Vendors are still very much in the driver’s seat in these markets and buyers have little in the way of leverage to negotiate, or time to consider their purchase decision.
The strong selling conditions can also be seen in the average selling time, which is tracking at 31 and 32 days in Sydney and Melbourne respectively. Canberra and Hobart are showing the third and fourth fastest average selling times across the capital cities, at 44 and 48 days respectively.
With real estate agent activity across CoreLogic platforms easing over the past two weeks, it suggests that we may have moved through the peak of new listings activity. Additionally, as we move into the first month of summer, the housing market is likely to remain active for another two weeks before we start to see the normal seasonal slowdown in buyer numbers.
After four and a half years of strong value growth, Mr Lawless said it’s hard to imagine a reacceleration in property values could be long lived.
Affordability constraints are creating high barriers to entry, particularly in Sydney, and lenders are becoming more cautious in their lending practices. The supply pipeline is substantial for inner city units, which is likely to dampen value growth in these precincts as well as dent buyer confidence and push vacancy rates higher.
Additionally, buyer enthusiasm could be muffled by speculation that interest rates may rise late next year, with fixed rates already starting to edge higher.
With household debt at record levels, Australians are very sensitive to the cost of debt, and an expectation that the period of record low mortgage rates is approaching an end may reduce buyer demand.
Tim Lawless is head of the CoreLogic research and analytics team and can be contacted here.

