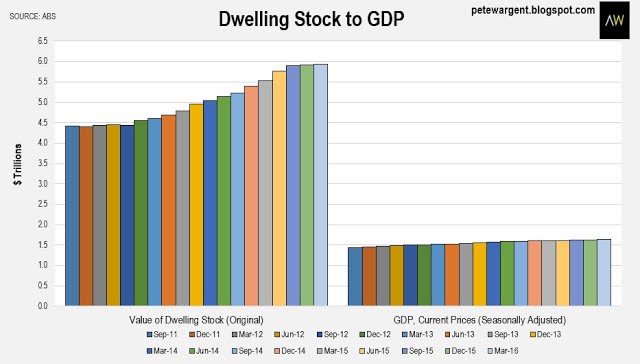
Some years ago there were doomsday predictions of a property correction in Australia since dwelling prices had reached three times the value of our Gross Domestic Product (the exact relevance of the three times figure was never adequately explained).
Today, the ratio is just over 3.6 times, having ticked down slightly over the past six months of publicly available official figures.
Is there a link between the two measures? Kind of, but it's not very strong.
In fact, as a predictor of property prices the ratio has been useless in recent years. Actually, no, it's been worse than useless - it has been a contra-indicator!
One problem with GDP is that it's historic in nature, so at best it tells you what was happening in the economy months ago - thus as an indicator of future outcomes it's necessarily all that useful.
More pertinently this ratio doesn't make a lot of logical sense since it compares a stock value at a fixed point in time with a flow, being the value of goods and services produced over a specified period of time (in the example in the chart below, one year).
Furthermore, some types of property in thinner markets fare much better in times of boom, and worse in times of bust. And some types of property in some inner suburban locations tend to outperform the averages over time, while properties is lower demand generally fail to keep pace with the averages.
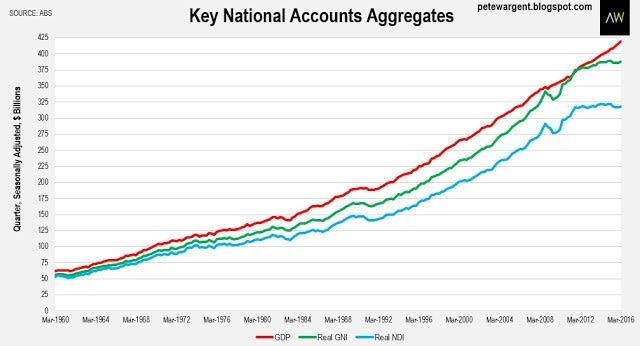
Key national accounts aggregates
In today's electronically connected world, hordes have wanted to be the person to 'call' the next Australian recession. But the economy has proved to be surprisingly robust, with the annualised rate of GDP growth for the past six months accelerating to 3.6 per cent.
The riposte has been that GDP is the "wrong" measure - we should ignore GDP and look at national income.
It is indeed true that real (i.e. adjusted for inflation) gross national income has stalled, but then again Australia's commodity prices could not and did not grow to the sky, so this isn't necessarily that surprising.
Another way to look at this is that national income has more than doubled over the past twenty years, even after accounting for inflation.
Moreover, if GDP is an unreliable measure of the performance of the economy, how can it be a good measure of dwelling prices? Can't have it both ways!
National accounts
The national accounts provide us with a range of figures relating to the property markets, but as implied by the name of the data release the figures are national and backward-looking in nature, and therefore don't really tell us much of interest about what sub-regional property markets are up to or will be up to.
As noted, the national accounts lag a bit, but broadly home owners owe about $1 trillion in mortgage debt, and investors about $550 billion. What is not so well shown by these figures is that mortgage buffers and offset accounts are also at record high levels.
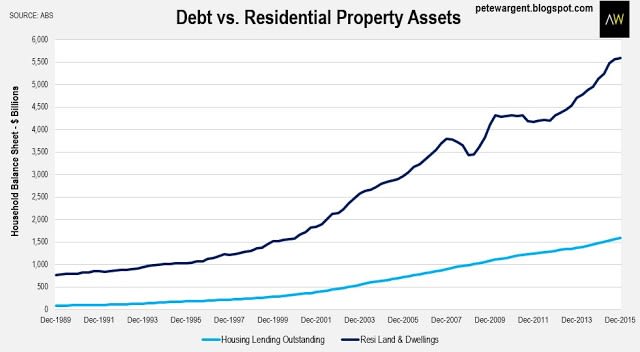
With dwelling price growth having outpaced the growth in household debt, gearing ratios have declined in recent years.
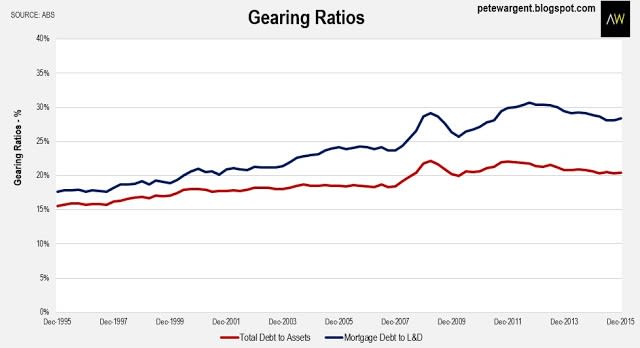
None of which tells of much of any predictive value. We can all think of housing markets in Australia that are overvalued; but equally we can all name others where prices are getting walloped or have already crashed.
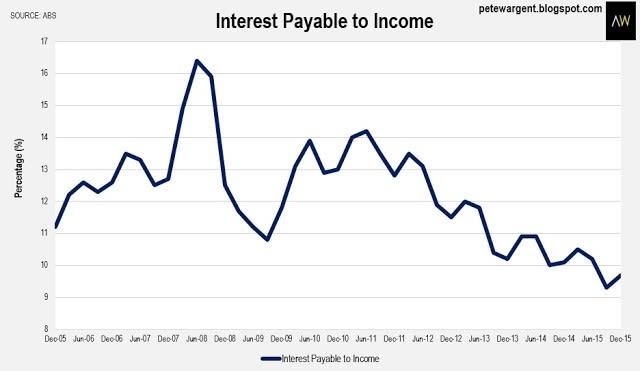
If there is one ratio from the national accounts which is useful in predicting where to next for dwelling prices - and I'm not saying that there necessarily is - it's the ratio of housing interest payable to income.
The actual quoted percentage figure is skewed lower since so many households have no mortgage debt at all, but has declined from a peak of 16.4 per cent in June 2008 to 9.7 per cent by December 2015.
On this measure, mortgage repayments are more than 40 per cent cheaper than they were at their 2008 peak.
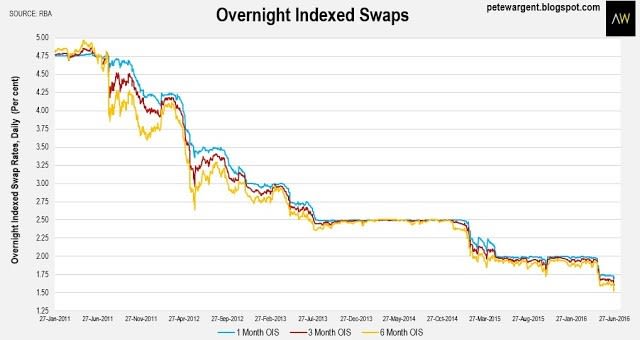
Rates heading lower?
It would be fair to say that if mortgage rates head back to where they were at their most recent peak of about 8 to 9 per cent, then many of Australia's housing markets are heading into correction territory.
It's an interesting bet if you want to take it on. But money markets are begging to differ, with yields grinding out new lows in anticipation of possible Brexit turmoil.
Yesterday Australia's 10 year government bond yield fell to its lowest ever level at well below 2 per cent.
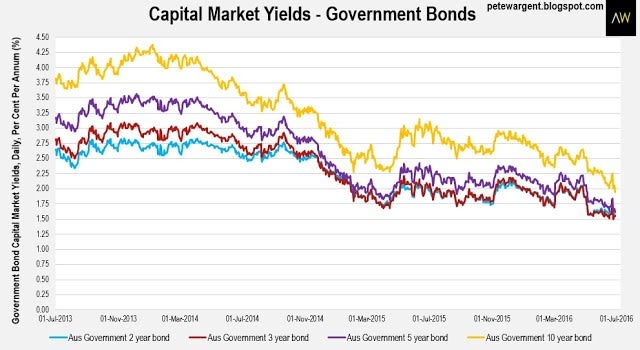
Meanwhile, OIS rates are on a seek and destroy mission to crunch out new record lows, and they are winning that particular battle. We are now just one benign inflation print from seeing a new record low cash rate in August.
Click to enlarge