
How much money is there? Pete Wargent

One of the occupational hazards of middle age is that from the mouths of babes can spout seemingly simple questions which are devilishly difficult to answer.
This troublesome issue was highlighted in a wittily observed Bigpond advert a decade or so ago, in which a hapless father answers to his curious son that the Great Wall of China was built by "Emperor Nasi Goreng...to keep the rabbits out."
The difficulty in answering an apparently straightforward question such as "how much money is there?" is twofold. Firstly, this is because the answer depends on what you mean by "money". And secondly since the money supply is a moving target, by the time you have scraped together a coherent answer more money will inevitably have been created.
How much money is there?
For those of us with bank accounts today, generally we don't come in to direct physical contact with most of our money. Instead, we just see a number on a screen which changes daily.
The latest figures from the Reserve Bank of Australia (RBA) showed that the total there is more than $65 billion of currency and $250 billion of current deposits - for a total of just over $315 billion which is represented by the green line in the chart below and known as the "M1" measure of the money supply in circulation.
It's an arresting thought that in the years since I was born there is more than 30 times more M1 money knocking around in Australian circulation.
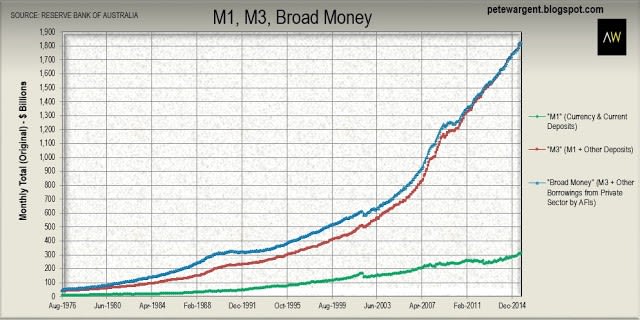
Of course, as the above chart shows, the green line is only a small and increasingly insignificant part of the money supply, partly because today most of us use alternative forms of payment, including credit cards and EFTPOS.
The red line in the chart above (known as "M3") - which includes term deposits, certificates of deposit, and various other deposits from building societies and credit unions with banks - totals well over $1.8 trillion, the dollar value of M3 money in circulation having increased by more than 45 times over the same time period.
The red line in the chart above (known as "M3") - which includes term deposits, certificates of deposit, and various other deposits from building societies and credit unions with banks - totals well over $1.8 trillion, the dollar value of M3 money in circulation having increased by more than 45 times over the same time period.
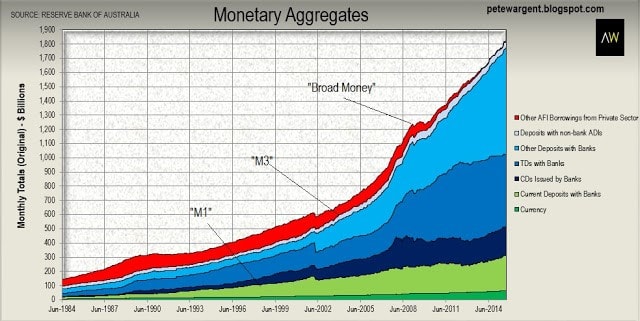
Adding the green shaded areas in the graphic above (currency and current deposits, or "M1") to the blue shaded areas (the aforementioned other deposits) gets us to "M3", while there is a broader measure of money still, which funnily enough is known as "broad money" - it includes certain other borrowings denoted by the red shaded area.
All up the money supply comprises $1.83 trillion of broad money in circulation.
All up the money supply comprises $1.83 trillion of broad money in circulation.
Boiling frogs
One thing that we all learn in childhood is that if something that a lot of people want is scarce, then it tends to go up in value. Unfortunately, however, the supply of money has been anything but scarce.
While 6.3% growth in M3 money over the past 12 months (following on from 8% in the preceding year) may not sound like all that much, due to the power of compounding these cumulative increases in the money supply have snowballed into an enormous expansion.
This, of course, is why folk have tended not to leave large sums of money in their bank accounts earning low returns for too long, and often instead aim to invest in inflation-busting businesses, "hard assets" with intrinsic value such as gold and silver, or well-located residential property with a high land value component.
Over time we expect the price of quality assets in high demand to appreciate, while the value of any associated debt is surprisngly quickly inflated away. Only one decade ago the broadest monetary aggregate ("broad money") showed $784 billion of money supply in circulation, an amount which has comfortably doubled and then some to $1.83 trillion today.
Summarily there is well over double the amount of money chasing a limited supply of desirable assets. These figures are in themselves powerful enough, but in truth even the money supply in circulation represents only one part of the tale.
Summarily there is well over double the amount of money chasing a limited supply of desirable assets. These figures are in themselves powerful enough, but in truth even the money supply in circulation represents only one part of the tale.
The other part of the story is that of "credit", being loans, advances and bills discounted to the private sector (but excluding loans made to other financial intermediaries).
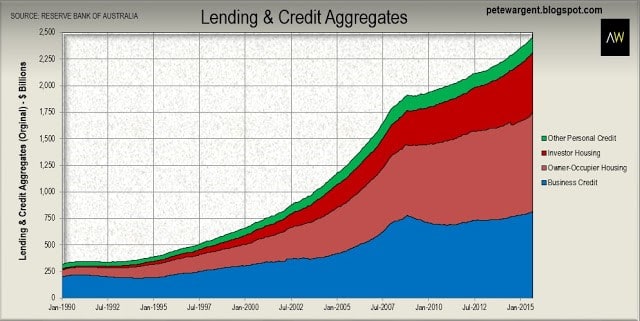
Note in the chart below the massive surge in credit growth following the deregulation of the financial system in 1983 which lasted all the way through until the early 1990s "recession we had to have".
Note in the chart below the massive surge in credit growth following the deregulation of the financial system in 1983 which lasted all the way through until the early 1990s "recession we had to have".
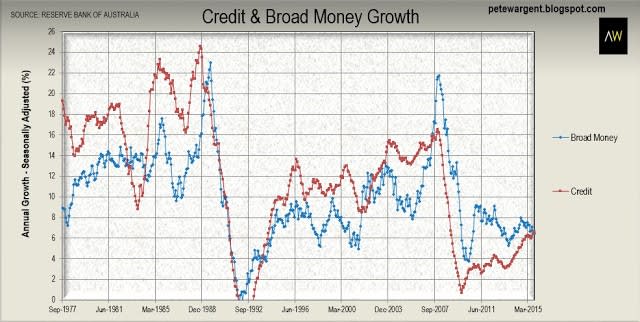
While there is not necessarily a link between the expansion of the broad money supply and growth in credit, the data over the long run suggests that a relationship between the two clearly exists, albeit a complex one.
As explained by a Bank of England research paper last year, the way in which most money is created in a modern economy is through banks making loans. When a bank creates a loan, it also creates a deposit in the borrower's bank account (and in turn it follows that if a bank lends me money to buy your house, then that after the settlement you will have more money in the form of a deposit).
Thus, contrary to what you might intuitively expect, deposits are not created by households saving income, but by banks creating money through loans, although of course there is ultimately a speed limit as to how much banks can lend.
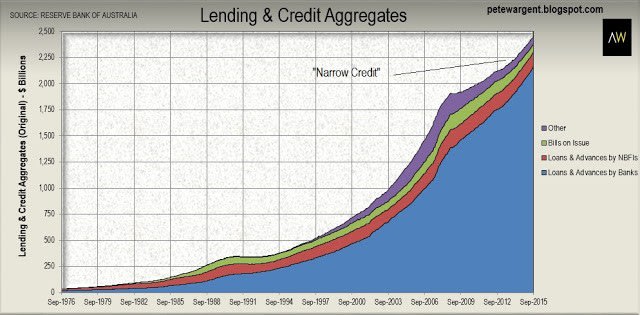
The above chart shows what has happened to the amount of "narrow credit" (a measure which excludes securitisations) sloshing around Australia since 1976, which is to say that it has expanded at an even more furious pace from $36 billion to nearly $2.4 trillion, thereby increasing by an astonishing factor of more than 66 times.
While back in the year I was born housing accounted for only 24% of ourstanding credit (refer to the red shaded areas in the chart below), today that figure has expanded to 61%, with housing credit growth continuing to outpace the growth in lending to businesses.
There are a number of identifiable reasons for this trend, but probably the most significant of these is simply that banks love to lend against housing - for even if you default on a mortgage you cannot easily take the house with you, and in any case the land that it sits on isn't going anywhere.
There have been many predictions of falling house prices over the last decade, but a bet against housing has essentially been a bet against the above chart, which shows that over the past ten years the stock of outstanding housing credit has more than doubled, from approximately $700 billion to $1.5 trillion.
Of course, the price of all residential property has not increased as a result of this flood of credit. There is no scarcity of land in many mining regions, for example, and the demand for it has been declining in recent years, resulting in spectacularly crashing prices in many cases. Outer suburban Sydney property is now correcting sharply in some instances due to similar dynamics.
It would be true to say, however, that suburban land values in capital cites have generally been increasing strongly over time.
It would be true to say, however, that suburban land values in capital cites have generally been increasing strongly over time.
The outlook for credit growth
Onthe subject of speed limits, the regulatory body APRA recently decreed that it would like to see lenders growing their investor mortgage books at a pace of no faster than 10 per cent per annum, and for this reason we can expect to see banks instead pushing products in their largest and most profitable market sector, being owner-occupier housing credit.
The private sector credit figures arguably represent one of the more significant indicators of what is happening in the domestic economy, and for this reason I analyse the data on this blog at the end of each calendar month.
As I looked at in more detail at the end of last month the series showed that while commodity prices may be tanking over the year to September annual business credit growth moved up to a 79 month high of 6.3%, while housing credit growth had also accelerated to a 60 month high of 7.5%.
Now sure, 7.5% is certainly a lower level of growth for housing credit than we have seen in cycles past - mainly because we are starting from a higher base - yet if sustained it would be enough to more than double the stock of outstanding housing credit to beyond $3 trillion within the next decade, which is food for thought (gulp).
whether or not banks can continue to expand owner-occupier credit growth will be one of the key housing market narratives to watch over through 2016. I'll analyse all the key figures here, of course.
PETE WARGENT is the co-founder of AllenWargent property buyers (London, Sydney) and a best-selling author and blogger.
His latest book is Four Green Houses and a Red Hotel.
Pete Wargent
Pete Wargent is the co-founder of BuyersBuyers.com.au, offering affordable homebuying assistance to all Australians, and a best-selling author and blogger.

