
Long run residential prices: Pete Wargent

The ABS released its Residential Property Price Indexes to June 2015 last week.
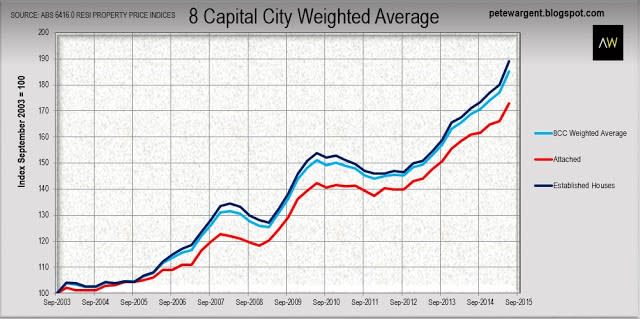
As you can see in the first chart below, over the dozen years since September 2003 on average established capital city houses (+89%) have outperformed attached dwellings (+73%).
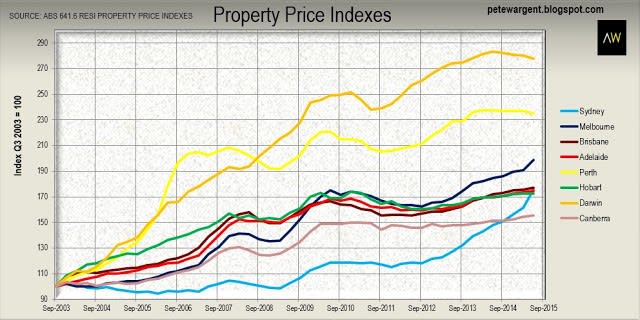
Since the full ABS indices only track back to Q3 2003, Sydney will naturally appear to be a moderate performer on this index, since the harbour city's preceding boom peaked on this data series almost immediately thereafter in Q4 2003.
A number of cities in resources regions also performed strongly through the mining construction boom, although that particular dream has turned on a dime into an illiquid nightmare for many owners of property in mining towns.
Houses
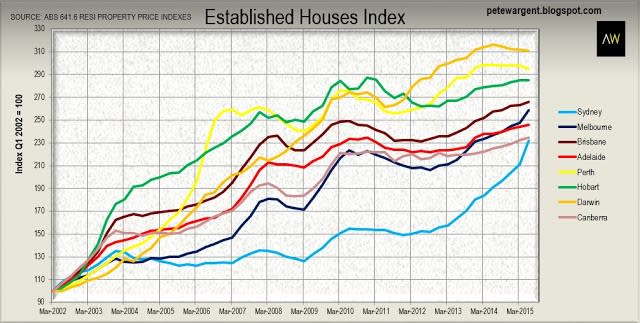
Looking in the second chart below at established houses only since Q3 2002, Sydney has been playing some serious catch-up over the past three years.
Looking in the second chart below at established houses only since Q3 2002, Sydney has been playing some serious catch-up over the past three years.
Melbourne has also had a solid run, while there have been some steady gains of late for Brisbane, Adelaide and Hobart.
The most interesting point of note is how the long run data since 2002 seems to imply a convergence of the results for all eight of the respective capital cities.
The most interesting point of note is how the long run data since 2002 seems to imply a convergence of the results for all eight of the respective capital cities.
Attached dwellings
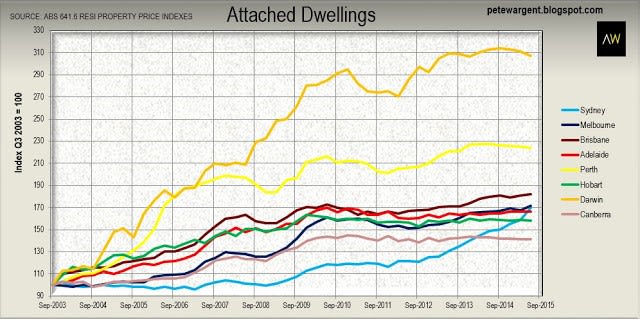
Meanwhile the attached dwellings only index below reveals a similar pattern, although on average it records a slightly less dramatic incline through the present cycle to date, but less impressive growth in a number of cheaper cities where demand for apartment dwelling is less robust.
Note that the ABS data for attached dwellings only runs back to Q3 2003 which partly accounts for the lower growth over the full history of the data.
Of course while these figures are useful indicators they are based upon averages and can mask any number of sub-trends.
Suburbs
Suburbs
The same holds true for long run analysis of median prices at the suburb level, where miniscule sample sizes can skew results materially.
There has also been the small matter of a once-in-a-century mining boom combined with a one-off structural shift to lower interest rates to take account of.
As as a result those "top 100 best performing suburbs" lists almost invariably include a number of remote suburbs that few people have heard of where median house prices are around $150,000.
Since $150,000 is more or less the cost of building a house today, it follows that the real appreciation in land values has actually been weak, and the strong "growth" results are just as likely to be quirk of sampling.
The house I grew up in is a great example, having apparently achieved incredible compounding capital "growth" of an amazing 9 per cent per annum for fully 35 years!
Thing is, you take off the cost of the extension, the replacement of the dodgy carport with a garage, and various upgrades to the interior, and the capital growth in real terms has been zero percent.
Cheaper properties can sometimes come with other associated problems - such as tenancy or vacancy risk - while any unfortunately substantial repair cost (e.g. for the roof) can wipe away years of returns at a stroke due to the lower base cost of the asset.
Moreover suburb median prices are by and large a waste of time - the only statistics that really tell you anything worthwhile when it comes to real estate are like-for-like sales.
PETE WARGENT is the co-founder of AllenWargent property buyers (London, Sydney) and a best-selling author and blogger.
His latest book is Four Green Houses and a Red Hotel.
Pete Wargent
Pete Wargent is the co-founder of BuyersBuyers.com.au, offering affordable homebuying assistance to all Australians, and a best-selling author and blogger.

