
How do we fare compared to last year’s Housing Boom and Bust report? SQM's Louis Christopher

GUEST OBSERVER
The forecasts verses actuals reveal the nation outside Sydney is recording slightly weaker growth than we expected and Sydney is recording more robust growth than what we expected for this year.
Why?
- The mining downturn is having a considerable impact in a number of cities.
- Listings remain well supplied, particularly in Brisbane, which itself has been a victim of the downturn, represented by higher than average unemployment (particuarly white collar) and manifested through high CBD offices (and residential vacancy rates).
- The second rate cut of May 2015 was not built into our forecast. As a result Sydney has risen faster than our more optimistic expectations.
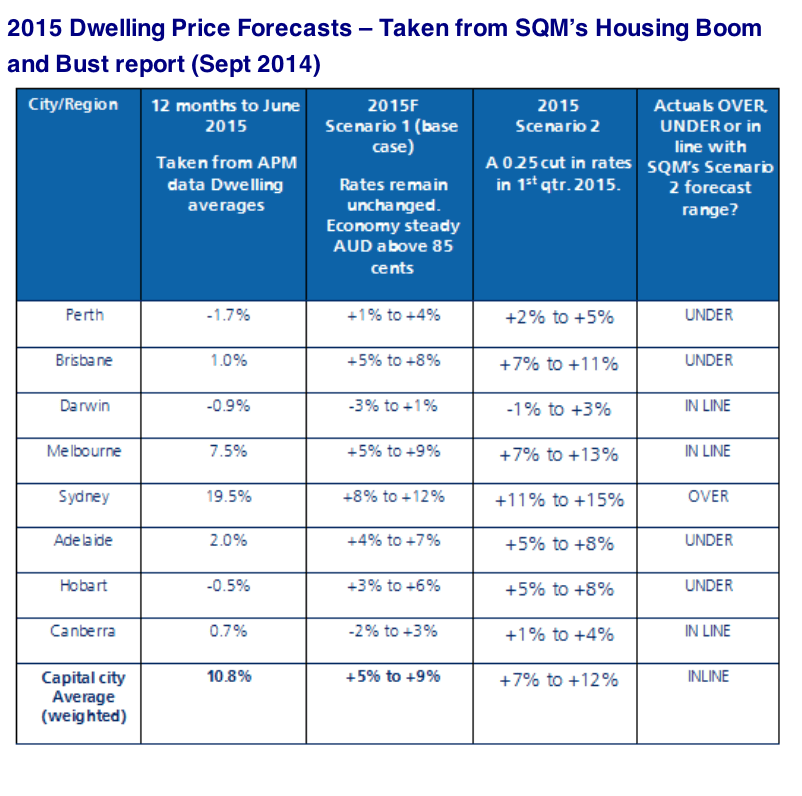
Note our forecast was for dwellings based on the ABS data. The ABS is not reporting for the June quarter until the end of September so we have decided to use the APM data on the interim.
Our base case scenario became redundant once rates were cut in February and the dollar sank below $U.S 85 cents (December 2014). That put Scenario Two squarely in focus which was for more robust growth with Sydney leading the charge once again at 11-15%. We formally updated the market about this change at the end of March.
By all accounts, Sydney has done more than our forecasts so far this year. The second rate cut of May ensured this with property investors entering into a frenzy that shot the average Sydney house up by an estimated $50,000 in just a few short weeks. Literally, the market ‘gapped up’. Since then I get the impression the market is still testing those highs and is struggling to move much further. This is illustrated by lower auction clearance rates recorded in the past 8 weeks then the preceding period. Going forward, clearance rates will fall in Spring (as they always seasonally do). Most likely they will fall to the mid 60s. If they so happen to fall below 60% then something more negative is going on. Otherwise it will be just a very normal Sydney market.
While we believed Perth was at a higher risk of a correction, we still believed the probabilities were that Perth would largely flatline on the basis that rate cuts would provide a soft landing. The rate cuts have provided a soft landing of sorts, but not to the point of stopping a correction. Perth dwelling prices are now falling. This is showing up in the APM numbers AND our own asking prices, which suggests vendors have lowered their asking prices on average by 4% over the past 12 months.
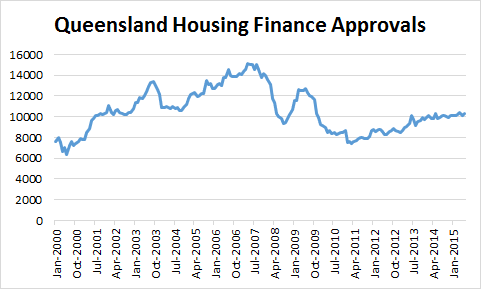
While downplaying other bullish forecasts for Brisbane in 2014, we did lift our forecasts for 2015. However Brisbane is proving to be largely flat-lining this year as well. The reality is underlying demand in Brisbane remains sluggish and investor related demand also soft. The total housing finance approvals chart for Queensland illustrates this story. Yes there has been a little pick since the downturn of 2010-2012 however this year housing finance approvals have been flat.
The end result is still more sellers than buyers in the market and this can be clearly seen on our stock on market index for the city. Until such time as there is a definite trend of declining stock, it is hard to see how Brisbane is going to record any substantial rise in prices, let alone a new property boom.
It is a similar story for Adelaide and Hobart, however we still remain more bullish on Hobart and think activity is increasing.
Nevertheless outside Sydney and Melbourne, it is indeed a patchy market. This present climate comes with investor credit lending now slowing, potentially as a result of APRA’s actions. APRA has very recently stated it is now going to take a wait-and-see approach to the market.
As APRA has now flexed its muscles and proved itself to be a key influencer on the housing market, it is interesting to note APRA’s current view of the world as presented last week, by the organisation’s chairman.
In short:
- APRA believe that that housing portfolio risk profiles might have increased, and underwriting standards have “softened”, over time.
- They believe house prices are “high” in areas outside Sydney and Melbourne.
- They are largely leaving up to the Approved Deposit Institutions (Banks etc) to determine how best to meet APRA’s 10% investor lending annualised growth rate threshold should be applied.
- They have left the door open to policies focussed on specific cities but for now will not employ such policies.
Perhaps the best way to gauge whether they will take further action down the track is by watching Investor housing credit which is published by the RBA. The latest result came out yesterday, which recorded a 0.6% increase in this measure. This was welcome news as the month result is below the annualised threshold of 10% growth set by APRA with some pundits claiming this is evidence of the APRA initiatives now working.
One way, or the other, it appears APRA are intent on keeping investor credit growth below their stated 10% threshold. Given that it has been investors that have predominantly driven the housing market upward since 2012 there are ramifications for this policy. And that is slower housing price growth at the national level for next year.
The magnitude of which we will explore in our 2015/2016 Housing Boom and Bust report, which is due to be released again later in September.
On the interim, we will shortly be releasing a Gold Coast outlook report including an assessment rating. That should be out on our website in time for next week’s newsletter. Needless to say, we have become rather bullish on the Coast.
Louis Christopher is property analyst for SQM Research. He can be contacted here.

