How the markets speak in volumes: Robert Simeon
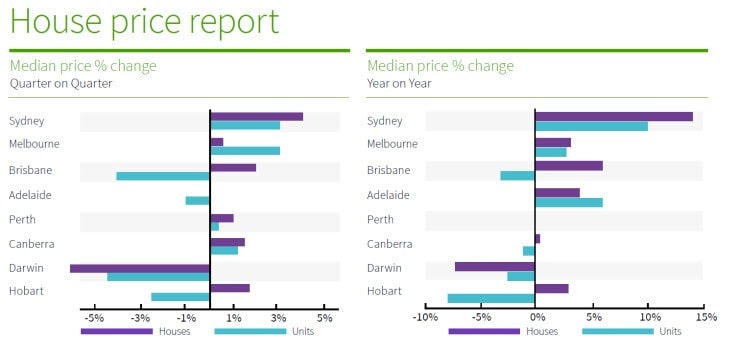
Last week the Domain Group published its house price report for the December quarter 2014 revealing that Sydney house prices rose 4.1% for the quarter up from 3.5% in the previous quarter.
Apartment prices also rose by 2.9% over the quarter which followed the September quarter which was also up 1.4%. Annually, Sydney house prices have increased by 14.1% and apartments have increased by 10.4%. All very interesting, however it means very little given this is the compiled figure for Sydney and is not representative across all households – even though many home owners believe it is.
For the first time that I can remember the top 10 Sydney house sales were all above $10 million mark, which is an amazing feat in itself.
No, I am not about to go into how the top end sales skew the median prices – given I treat this data with a grain of salt.
My preferred method is to look under the bonnet to see what actually is going on – by looking at the annual number of trades and the total volume of trades in dollar terms. I find this an interesting method which tells me much, much more about what exactly is happening in the marketplace for both apartments and houses.
This week I did just that – I broke down the figures for Mosman which has one of Sydney’s highest property turnover rates, and the figures are very interesting and in some instances quite amazing.
Mosman Houses
- 2014 – 329 recorded sales with a total value of $1,078,328,672 *
- 2013 – 379 recorded sales with a total value of $1,061,295,721
- 2012 – 286 recorded sales with a total value of $802,560,700
- 2011 – 271 recorded sales with a total value of $794,649,292
- 2010 – 316 recorded sales with a total value of $901,963,149
- 2009 – 279 recorded sales with a total value of $734,026,251
- 2008 – 247 recorded sales with a total value of $702,686,112
- 2007 – 376 recorded sales with a total value of $1,133,609,387
*This figure will increase as more sales settle in 2015
What this tells me is that Mosman house sales are getting back to where they were in 2007 (pre-GFC) given 2013 and 2014 both broke the $1 billion sales volume barrier.
- 2014 – 467 recorded sales with a total value of $461,024,250*
- 2013 – 482 recorded sales with a total value of $478,346,540
- 2012 – 472 recorded sales with a total value of $396,810,977
- 2011 – 477 recorded sales with a total value of $387,294,595
- 2010 – 473 recorded sales with a total value of $391,925,992
- 2009 – 484 recorded sales with a total value of $411,218,407
- 2008 – 442 recorded sales with a total value of $323,799,406
- 2007 – 485 recorded sales with a total value of $400,122,811
*This figure will increase as more sales settle in 2015
So for the past eight years the number of apartments sold in Mosman each year has been between 442 and 485. Houses however have ranged from 279 to 379, so it is much easier to predict how many apartments will be sold in 2015 – 473. Now that is what I would call baffling data.
Back in 2007 the cash rate moved from 6.25% to 6.75% where today it sits at 2.50% with many suggesting a strong possibility it will be cut next week when the Reserve Bank of Australia meets – I don’t believe they will cut at this point although further cuts are inevitable.

Source Domain Group
I find this Domain Group graph fascinating as it clearly identifies what many already know: markets are always self-correcting. Brisbane, Adelaide, Darwin and Hobart apartments are identifying value declines and Darwin is the only state/territory identifying house value declines despite a record low cash rate.
Will the Australian property investors start investing in these areas that are in decline? Absolutely not; investors much prefer to invest in areas identifying capital growth over declining markets given concerns that these markets will decline further.
Sydney’s overall vacancy rate sits at a very tight 2.0% despite concerns that the bull run of investors into the market has not even put a dent in the vacancy rate.
Only when you break down the numbers in demographic property markets do we start to clearly identify how the markets speak in volumes.
