Economy is strong, but little investment outside of housing: ANZ Research's NSW scorecard

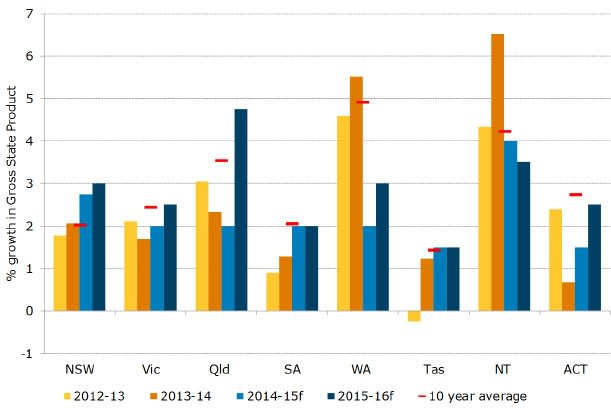
Household consumption – three-fifths of gross state product – strengthened noticeably in NSW over 2014 (+4.1% year on year) alongside faster growth in household income and dwelling prices.
FIGURE 1. POSITIVE GROWTH OUTLOOK FOR NSW
Source: ABS, ANZ Research
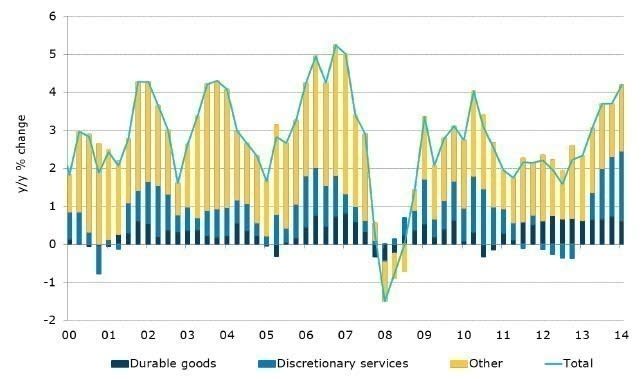
Discretionary spending, which is particularly sensitive to the economic cycle, grew strongly over 2014 (Figure 2). Spending on household goods strengthened in line with the pick-up in dwelling construction. Discretionary spending on services – recreation activities and hotels, cafés, and restaurants – also increased significantly over the year.
FIGURE 2. DISCRETIONARY HOUSEHOLD SPENDING HAS STRENGTHENED
Source: ABS, ANZ Research
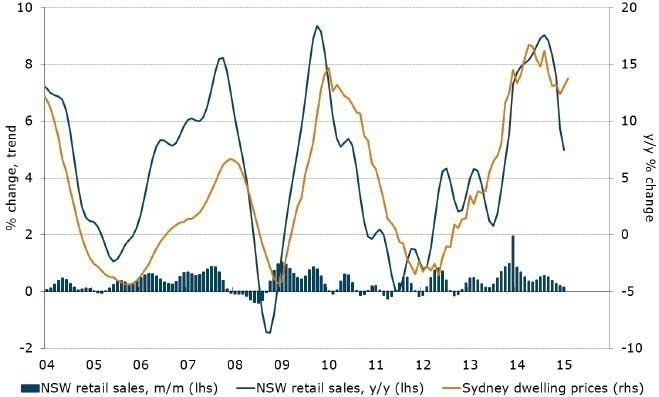
Consumer spending growth may be less robust this year as labour market conditions outside of Sydney remain challenging (see below) and house price growth is expected to moderate somewhat – retail sales growth in NSW has slowed considerably over the past six months or so (Figure 3). Nevertheless, strong population growth will provide ongoing support to spending and the lower currency will also direct a larger proportion of spending to local businesses.
FIGURE 3. NSW RETAIL SALES AND SYDNEY DWELLING PRICES
Source: ABS, Core Logic RP Data, ANZ Research
INVESTMENT HAS BEEN WEAK OUTSIDE OF HOUSING
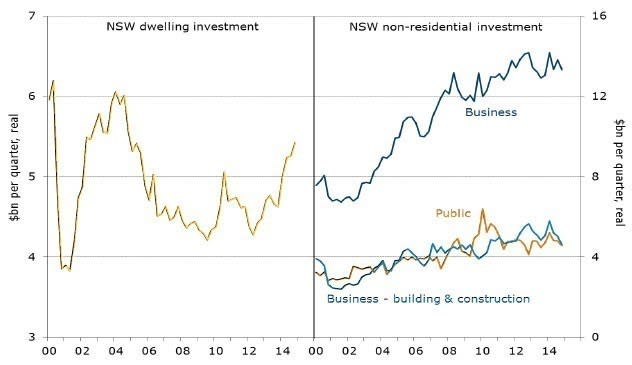
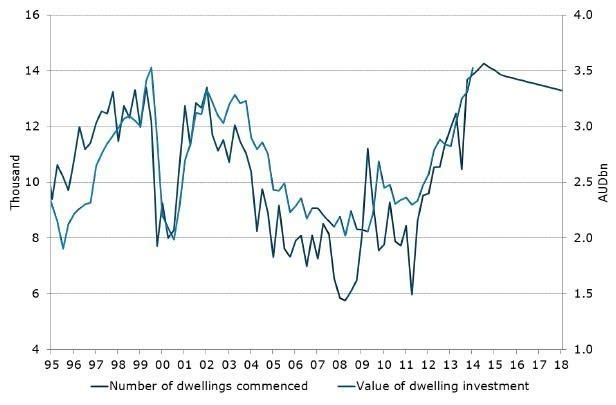
Dwelling investment in NSW has grown significantly over the past couple of years following a prolonged period of very low levels of building despite solid population growth (Figure 4). This has been driven by new housing construction, with renovations activity remaining subdued as it has nationwide. In contrast, business and public investment has been weak.
FIGURE 4. NON-RESIDENTIAL INVESTMENT HAS BEEN WEAK
Source: ABS, ANZ Research
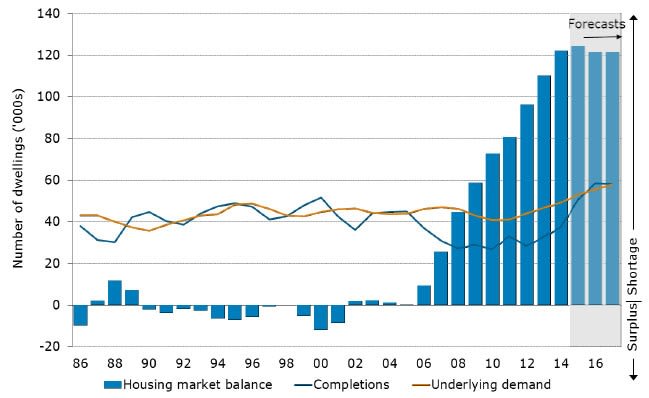
Residential construction is expected to grow further in the near term and then remain at a high level for a prolonged period (Figure 5). This would be very different to the typical boom-bust cycles in the past. This time, activity should continue to be supported by strong population growth, pent up demand, very low interest rates and ongoing house price growth in Sydney. Nevertheless, our analysis suggests that a sizeable net housing deficit will remain in NSW (Figure 6).
FIGURE 5. DWELLING INVESTMENT AND COMMENCEMENTS
Source: ABS, ANZ Research
FIGURE 6. NSW HOUSING MARKET DEMAND AND SUPPLY
Source: ABS, ANZ Research
In contrast to the strength in housing construction, business and public investment has been subdued in NSW. Equipment investment has been weak, like it has been nationwide and despite a substantial amount of non-residential building activity in and around the Sydney CBD, overall underlying non-residential construction in NSW declined by 8.1% year on year in 2014.
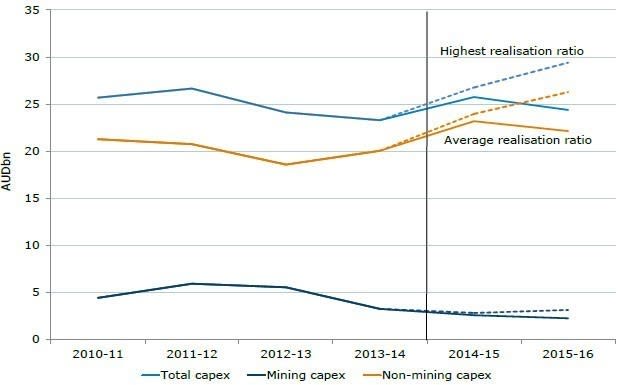
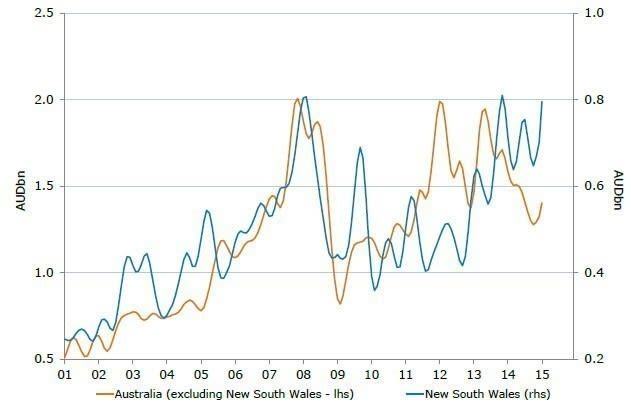
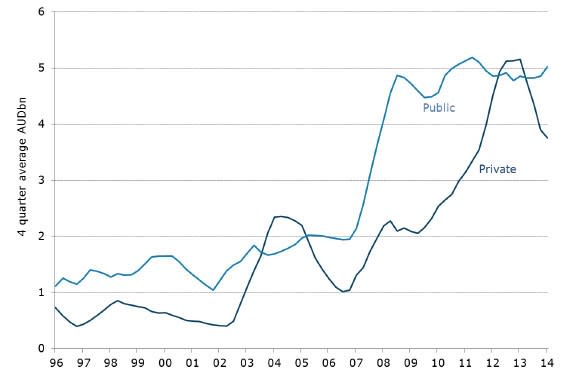
Falling mining investment has weighed on overall business investment (Figure 7). In contrast, non-mining capex has improved but the outlook remains very uncertain. Encouragingly, non-residential building approvals have risen to a high level and the pipeline of public engineering construction remains healthy despite the equivalent private pipeline weakening (Figures 8 & 9). Office market fundamentals have begun to improve as well.
FIGURE 7. NSW CAPEX & EXPECTATIONS
Source: ABS, ANZ Research
FIGURE 8. PRIVATE NON-RESIDENTIAL BUILDING APPROVALS
Source: ABS, ANZ Research
FIGURE 9. NSW ENGINEERING WORK YET TO BE DONE
Source: ABS, ANZ Research
This article continues on the next page. Please click below.
INFRASTRUCTURE SPENDING COULD HANG IN THE BALANCE
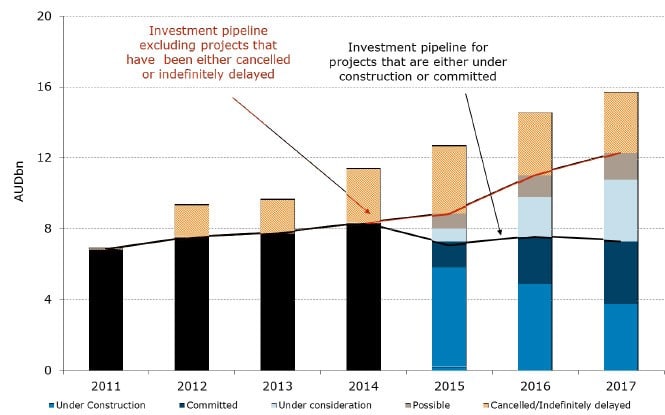
The NSW government has proposed a large pipeline of public infrastructure projects in recent years, particularly roads, highways, bridges and rail. Of critical importance is the impact that the upcoming election will have on the Government’s infrastructure plans.
The current pipeline of projects under construction and committed to in the Budget will go ahead under a Labor government. But Labor will not commit to stage 3 of WestConnex, a tunnel designed to link the planned M5 East tunnel at St Peters to the future M4 East tunnel near Rozelle. Moreover, the building of a second harbour rail crossing would not begin until 2022 under Labor (it is slated for construction as early as 2017 under LNP). The Coalition has tied $11.3 billion to urban roads and urban public transport, $4.1 billion for regional transport, and $3.5 billion for social infrastructure projects to the proposed asset sales.
Labor has committed around $10 billion less than the Liberal National Coalition to infrastructure as it is opposed to the ‘poles & wires’ privatisation and has a reluctance to increase debt.
FIGURE 10. NSW MAJOR PROJECTS PIPELINE
Source: BREE, company reports, Deloitte Access Economics, Infrastructure NSW, state government budget papers, ANZ Research
LABOUR MARKET DATA POINTS TO A DIVERGENT ECONOMY
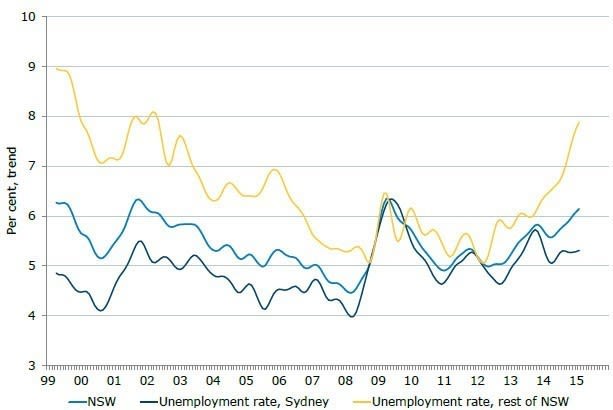
Labour market conditions have been weak outside of Sydney. While the unemployment rate in Sydney has remained within earshot of 5% for some time, the regional unemployment rate has risen sharply to nearly 8% (Figure 11). This will reflect mining-related weakness in some regions but also the lack of property boom seen in Sydney.
FIGURE 11. LABOUR MARKET CONDITIONS ARE WEAK OUTSIDE OF SYDNEY
Source: ABS, ANZ Research
THE HOUSING MARKET
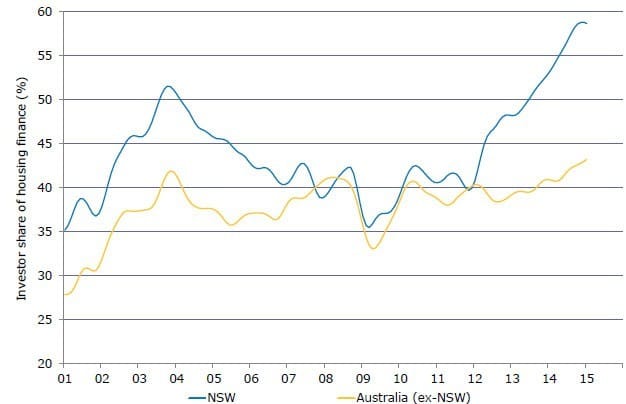
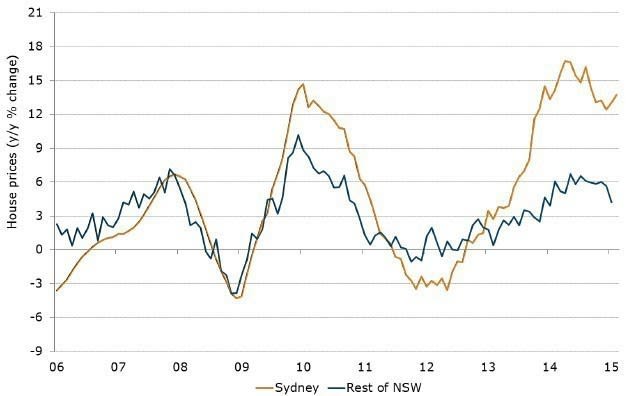
The Sydney housing market is very strong. The median dwelling price has risen 30% since January 2013 and sales activity has picked up strongly. Housing investor activity in NSW has been much more pronounced than in other states (Figure 12). Foreign investment has also been strong. In contrast to the Sydney market, regional NSW house price growth has been more moderate (Figure 13).
While Sydney dwelling prices now look to be around fair value, we see further gains of around 8-10% over 2015 amid low interest rates and as demand continues to outstrip supply.
FIGURE 12. HOUSING INVESTOR ACTIVITY VERY STRONG IN NSW
Source: ABS, ANZ Research
FIGURE 13. HOUSE PRICE GROWTH MUCH SLOWER OUTSIDE OF SYDNEY
Source: Core Logic RP Data, ANZ Research
THE BUDGET OUTLOOK – RIDING ON THE PROPERTY MARKET
Unlike other states and territories, NSW does not publish a fiscal outlook during the election campaign, which means it is more difficult to ascertain the most up-to-date fiscal outlook for the state.
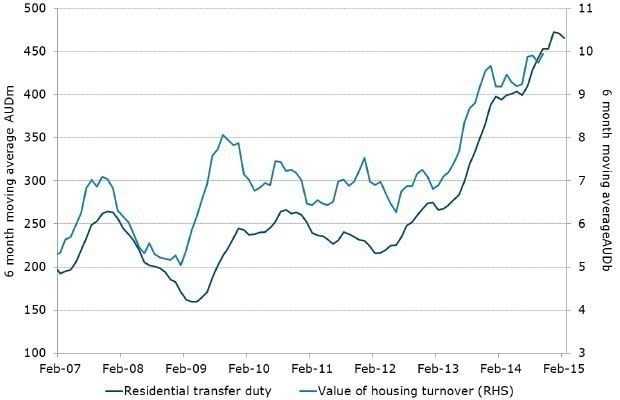
However, it is expected the state will deliver strong revenue from residential turnover and rising house prices. Figure 14 shows that residential transfer duty has increased sharply after a brief slow-down in the first half of 2014.
FIGURE 14. NEW SOUTH WALES TRANSFER DUTY
Source: NSW Government, ANZ Research
The outlook for housing turnover and house prices suggests that the NSW Government should benefit from elevated levels of residential transfer duty for some time. An easing policy cycle and strong house price growth will continue to spur existing property turnover and encourage the construction of new housing.
The mid-year review revised up the government’s expectations for residential turnover growth to 12% in 2014-15, driven mainly by higher house prices. Given the recent rate cut by the RBA and the expectation for a further cut next month, we would not be surprised if annual growth in residential transfer duty for 2014-15 exceeds this forecast.
The cyclical nature of the government’s own-source taxation revenue means that it needs stable funding to execute long-term infrastructure upgrades. Asset recycling is one way to go about this.
Neither party’s fiscal plans imply deterioration to the AAA stable outlook from both major rating agencies.
NSW SEMI GOVERNMENT BONDS
The aftermath of the Queensland state election saw a significant repricing in the level of Semi government bonds to both the ACGB curve and the swap curve. Queensland Treasury Corporation (QTC) bonds widened by around 20bp in the 10 year part of the curve. NSWTC issues also seem to be affected by this dynamic. Investors have been concerned with the shifting sands of the Australian electorate and this has been reflected in the level of Semi government spreads. It has clearly been a negative for NSWTC, as the first state to face an election since the Queensland poll in late January.
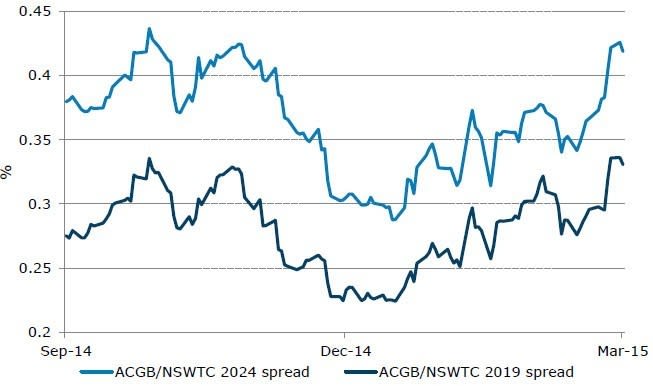
As Figure 15 shows, the spread of NSWTC bonds to the ACGB curve is at the widest point since the Queensland election. This surprises us to an extent for a number of reasons. Firstly, the NSWTC credit rating is stable at AAA. In the case of Queensland, market expectations had priced bonds to reflect the probability that the LNP would be elected. Furthermore, one ratings agency continues to hold a negative outlook on Queensland’s rating.
NSWTC bonds have also come under pressure due to investor preference for the debt of the Supranational borrowing entities from Europe. These borrowers, such as Germany’s KfW and Rentenbank, as well as the European Investment bank (EIB), have seen a strong performance in recent months after the ECB announced they would be bought as part of the ECB’s QE program.
Domestic investors have been better overall sellers of Semi government bonds to buy the Supranational bonds given the yield pick-up and the potential for outperformance of these names.
We believe the underperformance in NSWTC bonds is unwarranted and that the recent widening of spreads would be arrested by a strong mandate for asset sales.
FIGURE 15. WIDENING OF NSWTC BONDS AGAINST THE COMMONWEALTH
Source: Bloomberg, ANZ Research
In the event of a strong election win for the incumbent government, we believe NSWTC bonds should tighten by 8-12bp against the ACGB curve. The borrowing requirements for NSW remain low, with $4.6 billion of term issuance for the FY 2014-15. Moreover, as outlined above, the NSW economy is in a robust position which should be reflected in the spread to other borrowers.
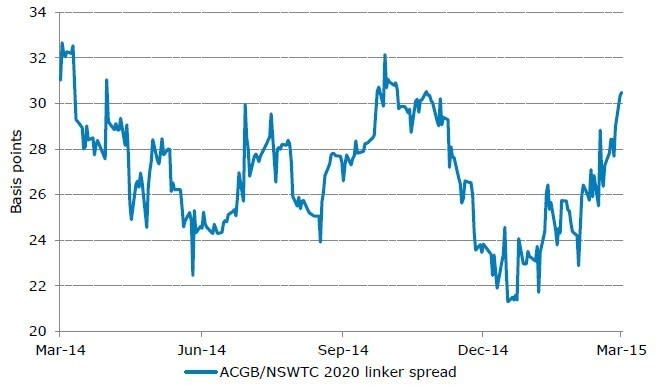
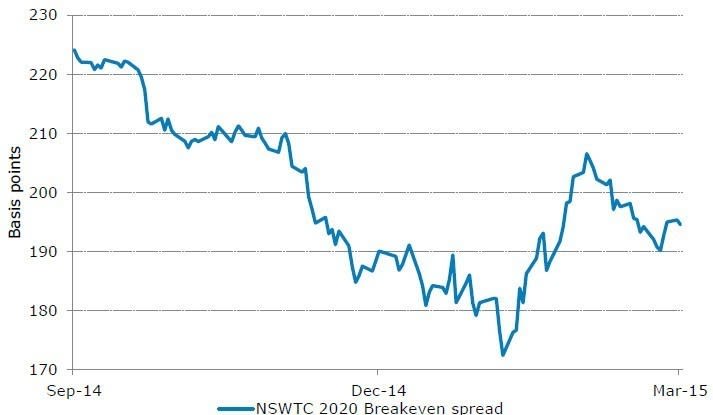
We also see the potential performance of the NSWTC index linked issuance. Much of the issuance of NSWTC’s index linked bond curve comes from electricity assets. In the event of asset sales, the need for this issuance would be reduced and should see the NSWTC index linked curve tighten against both the nominal and the ACGB curve.
FIGURE 16. WIDENING OF NSWTC LINKERS AGAINST THE COMMONWEALTH
Source: Bloomberg, ANZ Research
FIGURE 17. NSWTC INFLATION BREAKEVEN SPREAD
Source: Bloomberg, ANZ Research
Kirk Zammit is an economist with ANZ Research.
Justin Fabo is senior economist with ANZ Research.
Cherelle Murphy is senior economist with ANZ Research.
Martin Whetton is senior rates strategist with ANZ Research.