

Annual rate of housing market capital gains slips to slowest pace in 31 months: CoreLogic RP Data

The rate of home value growth continue to moderate as housing market conditions cool in Sydney and Melbourne, whilst the remaining capital cities recorded small value increases to moderate declines, according to the CoreLogic RP Data March Home Value Index.
During March, capital city dwelling values recorded a subtle lift, rising by 0.2 percent to take capital city home values 1.6 percent higher over the first quarter of 2016. The quarterly increase in home values was broad based across the nation’s capitals, with Perth (-0.9 percent) and Brisbane (-0.1 percent) the only two cities to record negative movements in dwelling values over the past three months.
“The March quarter rise in capital city dwelling values is in stark contrast to the first quarter of 2015, when values increased by 3.0 percent, which is almost double the current pace of quarterly growth. However, compared with the final quarter of 2015, when capital city dwelling values were down 1.4 percent, the housing market has shown a modest rebound in growth which is well below the strong capital gains recorded over the first half of 2015,” CoreLogic RP Data head of research Tim Lawless said.
“The annual pace of home value appreciation across Australia’s capital cities highlights the slowing growth trend,” he said.
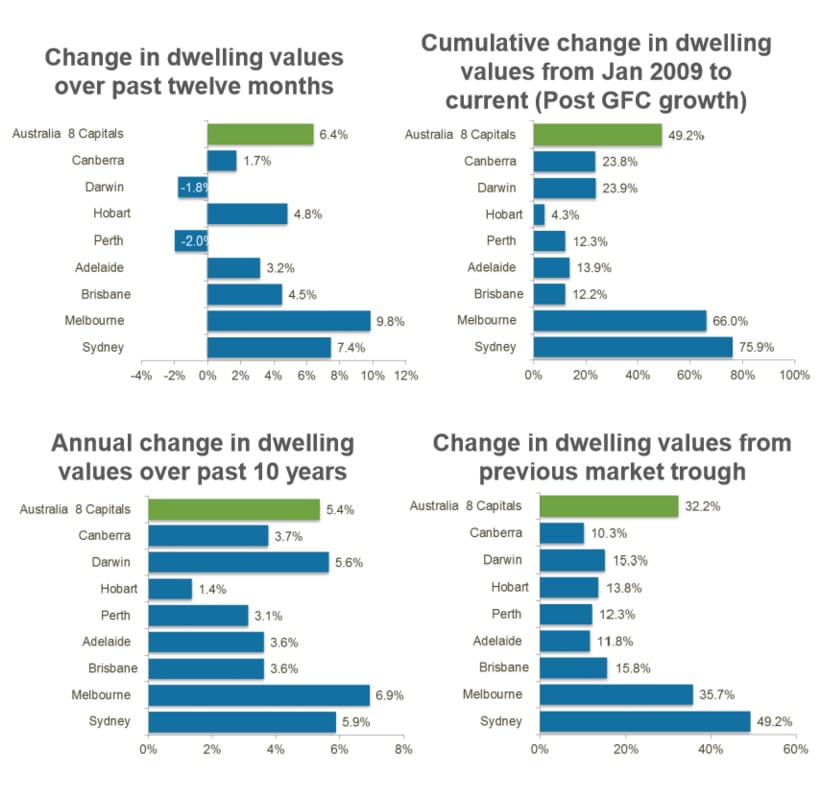
Following the March results, the annual rate of capital growth across the capital cities has now reached its lowest point in 31 months, with dwelling values rising by 6.4 percent over the past twelve months across the combined capitals. Furthermore, no Australian capital city has recorded an annual growth rate in the double digits over the past twelve months. Melbourne remains the capital city with the strongest annual growth, with dwelling values increasing by 9.8 percent over the past twelve months.
Lawless said, “The housing market has been losing momentum since July last year, when capital city dwelling values were increasing at the annual rate of 11.1 percent.”
Perth and Darwin are the only two capital cities where home values are trending lower on an annual basis, down 2.0 percent and 1.8 percent respectively. However, Lawless noted the moderation in the rate of capital growth in the Sydney market has been the most pronounced, with annual dwelling value growth more than halving to 7.4 percent per annum, from a high of 18.4 percent per annum in July last year.
The Melbourne market has been much more resilient, with annual growth in dwelling values slipping below the 10 percent mark for the first time since May last year, to reach 9.8 percent at the end of March 2016.
The current growth cycle has been running since values troughed in May 2012. Through to March 2016, capital city dwelling values have risen by a cumulative 32.2 percent. Over the cycle to date, Sydney home values have seen the most significant level of appreciation, with dwelling values 49.2 percent higher since values started rising, followed by Melbourne at 35.7 percent cumulative growth.
Darwin and Perth moved through their respective cyclical market peaks more than a year ago, with Darwin home values peaking in May 2014, whilst Perth’s housing market peaked in December 2014. Since then, both Darwin and Perth home values have fallen by a total of 4.6 percent.
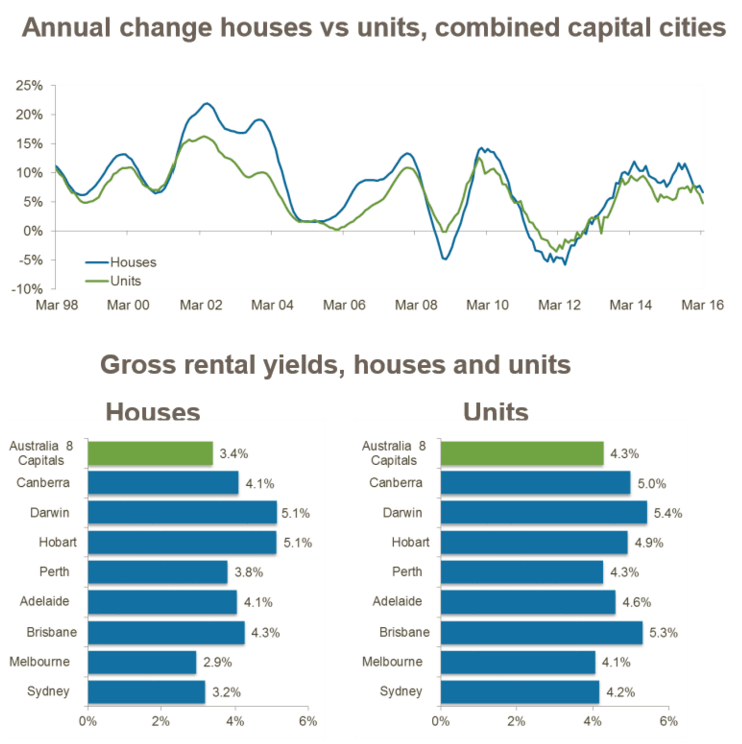
According to the March results, most capital cities continue to see the detached housing sector outperform the unit market. Over the past twelve months, house values rose by 6.6 percent compared with a 4.7 percent increase in unit values.
“The over performance by detached housing relative to units can most likely be attributed to the more efficient release of higher density housing supply together with an ongoing shortage of strategically located vacant land and new detached housing stock,” Lawless said.
The largest performance gap between houses and units is evident in Melbourne, where higher unit supply appears to be weighing on the rate of value growth. Melbourne house values were up 10.7 per cent over the past twelve months, whilst unit values are only 2.5 percent higher over the past year.
According to Lawless, “The CoreLogic December 2015 Pain and Gain report released last week showed 19.5 percent of all Melbourne council area units were resold at a gross loss, meaning, nearly one fifth of all apartments that resold over the last three months of 2015 did so at a price lower than what they were previously purchased for. Such a high proportion of loss making resales is a likely indicator of negative equity developing in this precinct as a result of supply outstripping demand.”
With the pace of capital gains slowing, the compression of rental yields has also eased, with capital city yields experiencing a small increase from their previous record lows. Every capital city has seen a deterioration in the rental yield profile over the past twelve months, with gross rental yields reducing from 3.7 percent across the combined capitals twelve months ago, to 3.5 percent at the end of March this year.
Melbourne continues to show the lowest gross rental yields, with houses averaging 2.9 per cent (which is still a record low) and unit yields averaging 4.1 per cent (up from 4.0 per cent).
Lawless said, “A low rental yield scenario in Melbourne and Sydney is likely to act as a further dampener to investment demand in these markets, as the prospects for capital gains become less certain.
“We’re likely to see many investors turn towards other housing markets where the outlook for capital gains is stronger, housing is more affordable and the yield profile is healthier.”
Other market indicators are pointing towards a continued moderation in the rate of value growth,” Lawless said.
Listing numbers have been trending higher, with the number of capital city homes currently being advertised for sale almost 8.5 per cent higher than a year ago. The most substantial lift in residential property listings has been in Sydney, where listing numbers are now 19.2 per cent higher than at the same time last year.
“Higher listing numbers means buyers have more choice and vendors may need to adjust their price expectations in light of the increase in available housing stock.”
“Additionally, housing finance figures are showing a trend towards fewer new mortgage commitments. Based on seasonally adjusted data from the Australian Bureau of Statistics to January, the value of owner occupier new mortgage commitments is down 7.6 per cent from last year’s peak, whilst the value of investor loans is 20.0 per cent lower compared to last year’s peak. Strict prudential supervision from APRA, as well as a potential rise in mortgage rates mooted for later this year due to higher lender funding costs, are likely to add to a further slowdown in credit growth during 2016.
“The lower number of housing finance commitments is also reflected in a slowdown in the number of homes transacting. For the twelve months to March 2016, an estimated 299,100 dwellings were sold across the capital cities, which is 9.9 per cent lower than the previous twelve month period. The number of homes sold across Sydney over the past twelve months is 18 per cent lower than a year ago, while Melbourne transaction numbers are 9.7 per cent lower year-on-year,” Mr Lawless said.
"Overall, no indicators have emerged to suggest that dwelling values are starting to show sharp declines in any of the capital cities. Perth and Darwin are the only cities to record negative value movements over the past year, and the declines from their recent peak which was more than twelve months ago have been modest at just 4.6 per cent. Sydney and Melbourne growth rates are moderating after a strong cycle of growth, while other cities are recording minimal shifts higher and lower.”
“Recent forecasts released collaboratively by CoreLogic RP Data and Moodys Analytics, reinforced a controlled slowdown in the Australian housing market was underway. Based on the forecasts, which factor in a series of short run indicators and long run macroeconomic scenarios, we are likely to see Sydney and Melbourne dwelling values continue to rise, at least on average over the 2016 and 2017 calendar year, however growth rates are likely to be substantially lower than what has been recorded over previous years, while some of the underperforming capitals, such as Brisbane, Canberra and Hobart may see some acceleration in their rates of capital gain by 2017.
