
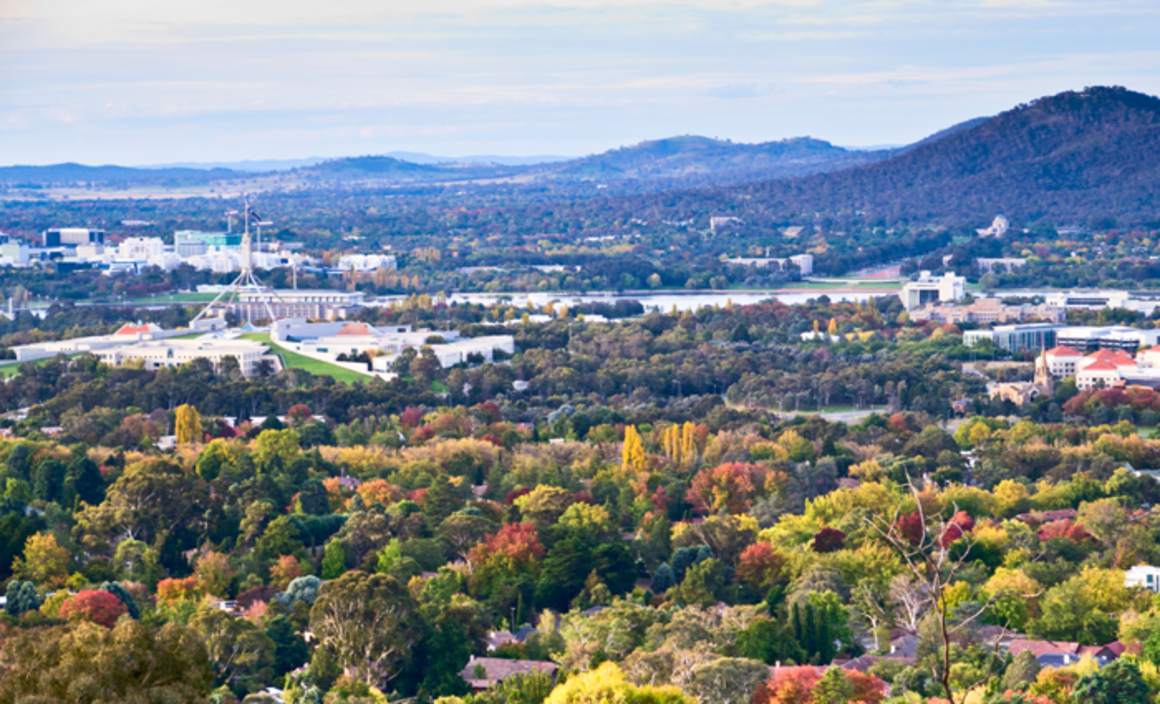
Canberra's population growth at five year high: CommSec
EXPERT OBSERVER
Australia’s population expanded by 387,969 people over the year to December 2017 to 24,770,709 people. Overall, Australia’s annual population growth rate fell from an upwardly-revised 1.67 per cent (previous 1.60 per cent) to 1.59 per cent - still near the fastest population growth in 3 years.
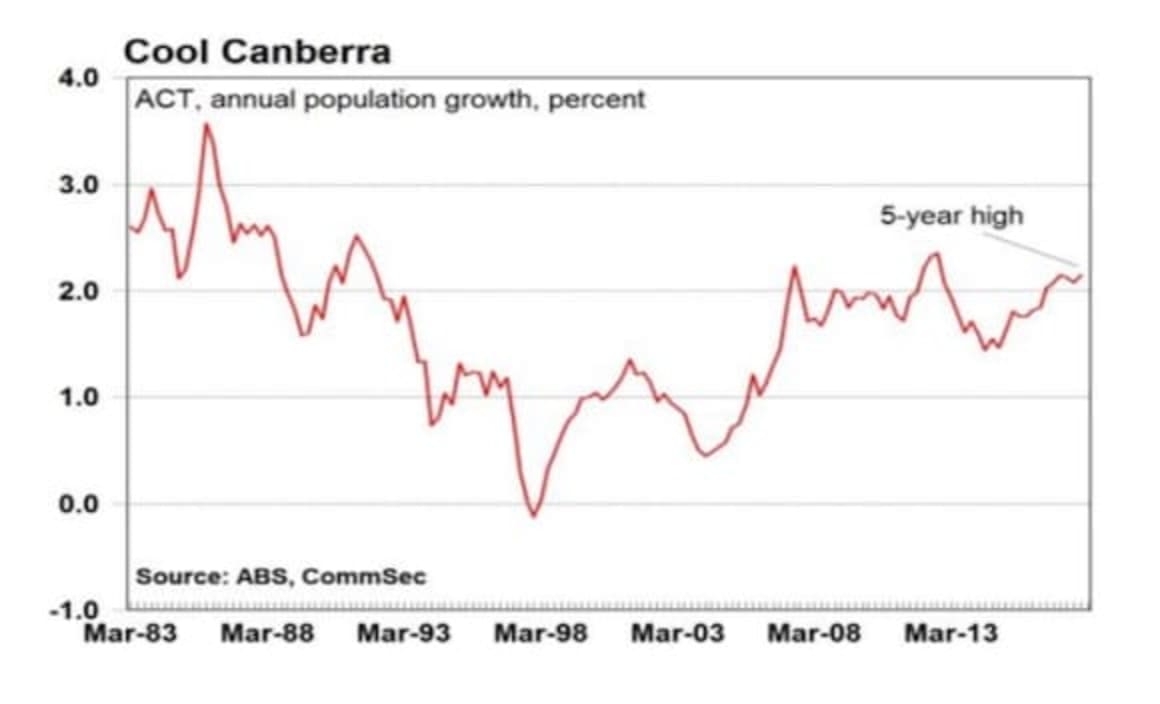
The ACT’s annual population growth rate rose from 2.08 per cent in the September 2017 to 2.15 per cent in the December quarter – the strongest growth rate in over 5 years.
Click here to enlarge.
Employment rose by 57,900 in the three months to May after a gain of 60,600 in the previous three months. Over the past 12 months, 307,600 people have found jobs, down from 415,900 in the 12 months to February – near the largest annual increase on record. A record 12.54 million Aussies are employed.
Over the quarter, employment rose most in Public Administration and Safety (up 88,900), Manufacturing (up 41,100), Professional, Scientific and Technical Services (up 29,100) and Accommodation and Food Services (up 22,700).
Healthcare and Social Assistance remains Australia’s leading employer, employing 1.7 million people or 13.3 per cent of all jobs. Retail Trade is in second place with 1.3 million employees.
Click here to enlarge.

In the year to May, 57.5 per cent of those aged 60-64 years and 13.9 per cent of those aged 65 years and over were in the job market – both record highs.
In the year to May, the average weekly actual hours worked per person employed was just 31.8 hours – a record low.
The demographic data on jobs provides insights on the job market, wages and prices, and ultimately on interest rates. The data on employment by industry gives insights into which industries are growing the fastest as well as insights on the performance of the broader economy.
What does it all mean?
The Reserve Bank recently said that immigration supports Australia’s ageing population. Net immigration slowed during the December quarter. In fact it was the slowest annual growth rate in 2½ years. Migration did account for 62 per cent of total population growth.
Canberra is cool. Long derided by other Aussies, population growth is the strongest in five years in the national capital. And its babies, not overseas or interstate migrants are driving population growth. According to the ACT government, natural increase will account for 62 per cent of the territory’s population growth by 2020.
Clearly Canberra is great for families, and its superior pay packets is attractive for young professionals. According to the Bureau of Statistics, Aussie public sector wages increased by 2.3 per cent over the year to March. And during the quarter to May, Public Administration and Safety jobs growth was the strongest across all occupations.
And there is no stopping Aussie Baby Boomers. There are more people aged between 60 and 64 years that are currently working than those not working. Senior Aussies are continuing to work due to improved health, technology, more jobs in the services sector, a need to boost superannuation savings and a rise in flexible work options. Older worker participation is expected to increase further because of a gradual rise in the retirement age from 65½ currently to 67 by 2023.
What do the figures show?
Population Statistics
Australia’s population expanded by 387,969 people over the year to December 2017 to 24,770,709 people. Overall, Australia’s annual population growth rate fell from an upwardly-revised 1.67 per cent (previous 1.60 per cent) to 1.59 per cent - still near the fastest population growth in 3 years.
Over the past year population growth was strongest in Victoria (2.30 per cent), followed by the ACT (2.15 per cent), Queensland (1.67 per cent), NSW (1.50 per cent), Tasmania (0.94 per cent), Western Australia (0.83 per cent), South Australia (0.62 per cent) and the Northern Territory (0.23 per cent).
The ACT’s population growth rate at 2.15 per cent is the highest since September 2012.
Australia’s population grew by 68,731 people over the December quarter, after growing by an upwardly-revised 104,450 people (previous 103,918 people) in the September quarter.
A total of 240,400 people migrated to Australia over year to December, up from an upwardly-revised 258,000 (previous 250,200 people) in the year to September. Migration growth is down from the peak of 315,700 migrants in the year to December 2008.
Net migration rose by 35,900 in the December quarter, but the change in annual migration in 2017 fell by 3,600 people, the slowest growth rate in 2½ years.
There were 308,500 babies born in the past year – lower than the record growth of 312,200 babies born in the year to March 2013 – but up by 4,300 births from the year to December 2016.
There were 160,900 deaths in the past year, up by 3,100 deaths from the year to December 2016.
Natural increase for the year ended 31 December 2017 was 147,500 people, up by 0.9 per cent or 1,300 people from the year to December 2016.
Industry Employment
Employment rose by 57,900 in the three months to May after a gain of 60,600 in the previous three months.
Over the past 12 months, 307,600 people have found jobs, down from 415,900 in the 12 months to February – near the largest annual increase on record. A record 12.54 million Aussies are employed.
Over the quarter, employment rose most in Public Administration and Safety (up 88,900), Manufacturing (up 41,100), Professional, Scientific and Technical Services (up 29,100) and Accommodation and Food Services (up 22,700).
In the quarter, the number of jobs fell by the most in Transport, Postal and Warehousing (down 29,300), Retail Trade (down 29,100), Education and Training (down 28,600), Health Care and Social Assistance (down 26,000) and Construction (down 20,000).
Over the year to May, 16 out of 19 sectors added jobs. The strongest gains were in Manufacturing (up 63,100), Professional, Scientific and Technical Services (up 52,700),Construction (up 47,100) and Health Care and Social Assistance (up 39,200).
Three sectors shed jobs over the past year including Transport, Postal and Warehousing (down 30,000), Other Services (down 28,900) and Retail Trade (down 400).
Health Care and Social Assistance remains the biggest employer with 1.7 million employees (13.3 per cent of the total) followed by Retail Trade (1.3 million jobs or 10.2 per cent), Construction (1.2 million or 9.4 per cent) and Education and Training (1.0 million or 8.0 per cent).
Detailed Employment
In the year to May, 57.5 per cent of those aged 60-64 years and 13.9 per cent of those aged 65 years and over were in the job market – both record highs.
At the same time that the participation of seniors are reaching new highs, younger Aussies are looking for work. But participation in the workforce of those between 15-19 years fell to 6-month lows of 54.7 per cent (year to May 2018). Workforce participation of those 20-24 years rose to 78.8 per cent in May, up from 78.6 per cent in April.
A greater proportion of young married women are also in work. In the year to May, an average of 75.6 per cent of married women aged 25-34 years were in the workforce – a record high.
In the year to May, the average weekly actual hours worked per person employed was just 31.8 hours – a record low. On average, people are working 2 hours a week less than they were a decade ago.
Why is the data important?
Demographic Statistics are issued by the Bureau of Statistics each quarter. The figures include estimates of births, deaths, in-bound and out-bound migration movements and estimates of population change by State.
The Australian Bureau of Statistics (ABS) provides detailed labour market figures one week after releasing ‘top level’ statistics of employment & unemployment levels across states and territories. The detailed data is useful in identifying broader underlying trends and instructive about the health of the economy.
What are the implications?
The job market should continue to improve over the coming year. Business conditions are at near-decade highs and indicators of job vacancies and advertisements are at the highest levels for around six years.
There is still spare capacity but it is slowly being used. Wages should gradually lift over the year amid emerging skills shortages in some industries. Improved job security and rising sharemarkets (the ASX200 is at decade-high levels) should support consumer spending, despite elevated household debt and falling home prices in some cities.
Australia’s population is still growing, albeit down from recent breakneck rates. Rising numbers of Aussies adds to demand for a raft of businesses across a range of industry sectors. The lift in the growth of the population – and the physical population numbers – lift demand for roads, schools and hospitals, thus boosting the outlook for builders, building material companies and construction companies. Health, education and construction workers are also in high demand.
Our way of life is changing and governments will need to meet the challenges of a larger population through superior urban planning and world class infrastructure, especially public transport in Australia’s growing capital cities.
CommSec expects official interest rates to remain unchanged until early next year.
Ryan Felsman is a senior economist at CommSec.