
Trump trade uncertainty adds downside risk to Chinese forecast: NAB's Gerard Burg

GUEST OBSERVER
China records a comparatively strong finish to 2016, but Trump trade uncertainty adds downside risk to our moderate easing forecast for 2017.
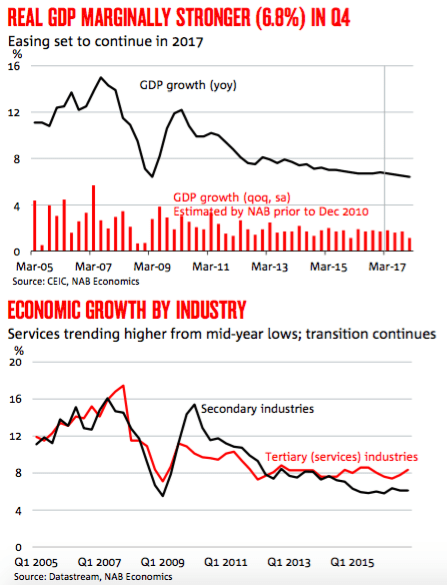
China’s official national accounts data recorded a modest pickup in growth in Q4, with the economy expanding by 6.8% yoy (up from 6.7% recorded in each of the first three quarters). For the full year, growth was the slowest since 1990, but remains in line with a soft landing, as the growth model gradually shifts towards domestic consumption.
NAB’s forecasts for Chinese economic growth are unchanged – at 6.5% in 2017 and 6.25% in 2018. That said, we continue to note risks to these forecasts – most recently the uncertainty regarding US trade policy under the Trump administration, the high levels of corporate sector debt and risks of price bubbles in real estate markets (despite recent cooling in price growth).
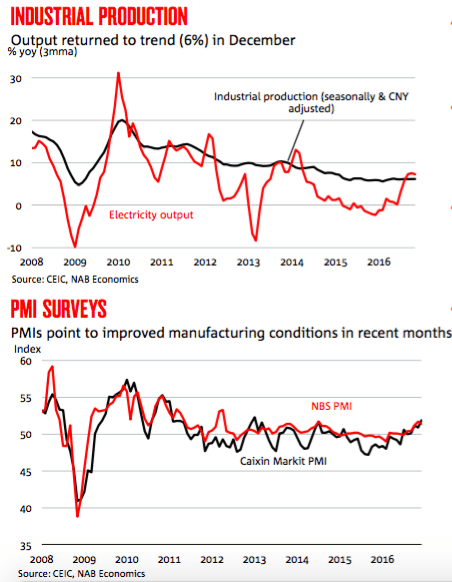
China’s industrial production growth was marginally softer in December – at 6.0% yoy (compared with 6.2% yoy in November) – essentially remaining around recent trend levels. Recent trends in PMI surveys point to improved conditions for manufacturers since the midpoint of 2015.
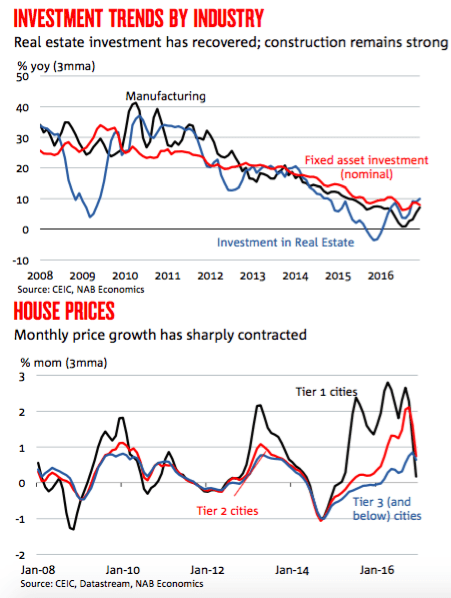
China’s fixed asset investment slowed considerably in December, despite real estate and manufacturing recording stronger growth. Construction activity is yet to show clear signs of slowing – with a fresh surge in construction starts in December – despite weakening house price and sales trends.
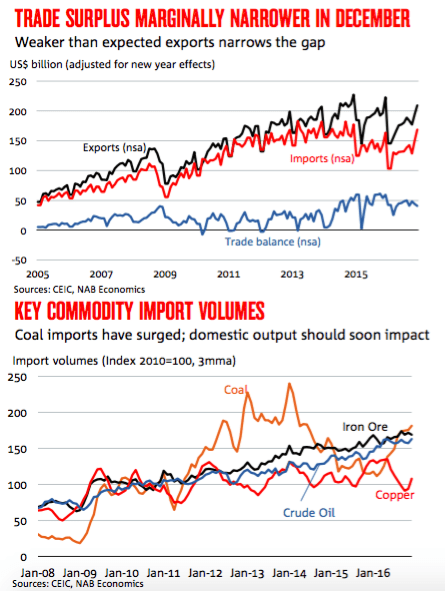
China’s trade surplus narrowed again in December, with import values recording a stronger month-on-month increase than exports. Commodity prices have surged in recent months – contributing to the rising trend in import values – with coal and iron ore prices remaining elevated.
Export values fell in year-on-year terms, however the sizeable discrepancy between Hong Kong and Chinese trade data (due to unauthorised capital outflows disguised as trade activity in late 2015) makes underlying trends in trade flows extremely difficult to ascertain.
Growth in retail sales edged slightly higher in December, but stronger retail price inflation has kept real sales below 10% yoy.
China’s credit expanded strongly in 2016 – with new aggregate financing totalling RMB 17.7 trillion (an increase of almost 15% from 2015). This was the largest expansion on record (exceeding the previous peak in 2013). Managing the growth of China’s already considerable debt pile – comparable to higher debt advanced economy levels – remains a key challenge for Chinese authorities in 2017 and beyond.
China’s official national accounts data recorded a modest pickup in growth in Q4, with the economy expanding by 6.8% yoy (up from 6.7% recorded in each of the first three quarters). This growth rate was slightly stronger than market expectations (at 6.7% in the Bloomberg survey).
For the full year, growth was the slowest since 1990, but remains in line with a soft landing, as the growth model gradually shifts towards domestic consumption.
The economic influence of the mid-year construction boom appears to have faded, with an acceleration in service sector growth across Q3 and Q4 – with services growing by 8.1% yoy (up from 7.8% in Q3). That said, property sales may have contributed to this trend – we will be looking closely at non-real estate and non-financial services data when this is released in the next few days.
NAB’s forecasts for Chinese economic growth are unchanged – we anticipate a slight easing in growth over the next two years, to average 6.5% in 2017 and 6.25% in 2018. That said, we continue to note risks to these forecasts – most recently the uncertainty regarding US trade policy under the Trump administration, the high levels of corporate sector debt and risks of price bubbles in real estate markets (despite recent cooling in price growth).
China’s industrial production growth was marginally softer in December – at 6.0% yoy (compared with 6.2% yoy in November) – essentially remaining around recent trend levels. This growth rate was below market expectations (at 6.2% yoy in the Bloomberg survey).
There was slower growth in construction related industrial products – with crude steel output rising by 3.2% yoy (down from 5.0% in November) and cement production falling by 1.2% yoy (compared with growth of 3.7% yoy previously). That said, at 67.2 million tonnes, crude steel output is not far below recent peaks.
Trends were more mixed in other industrial sectors. Motor vehicle output rose by 12.7% yoy (down from 17.8% yoy in November), electricity output was largely unchanged at 6.9%, and coal output was down 3.0% yoy. That said, coal production has risen considerably in recent months, following the easing of government imposed restrictions.
There was a slight divergence in trends in China’s main industrial surveys in December. The official NBS PMI survey was slightly softer, at 51.4 points (from 51.7 points in November) – albeit this level was the highest in over two years. In contrast, the Caixin Markit PMI pushed higher, to 51.9 points – the strongest reading since January 2013. Recent trends in these surveys point to improved conditions for manufacturers since the midpoint of 2015.
China’s fixed asset investment slowed considerably in December – with growth at 6.3% yoy (down from 8.3% yoy in November). The growth in state-owned enterprise investment – which surged across the middle of the year – slowed to 13.2% yoy (on a three month moving average basis) (down from 17.7% in November), while private sector investment has somewhat recovered from weak levels – at 5.0% yoy 3mma in December (from 4.3% previously).
Key sectors for fixed asset investment – such as real estate and manufacturing – recorded stronger investment growth in December – up by 10.0% yoy and 7.2% yoy respectively (on a three month moving average basis).
With real estate investment holding up, construction activity is yet to show clear signs of slowing – with a fresh surge in construction starts in December. Residential construction starts rose by 14.4% yoy (three month moving average) – up from -0.1% yoy in November, despite weakening house price and sales trends.
Official Chinese new house price data shows rose by 13.7% yoy nationally (compared with a peak of 14.0% yoy in November) – but just 0.6% month- on-month – the slowest rate of increase since February, and well below the 1.7% yoy peak across September and October. Growth in house sales has slowed – at 13.6% yoy 3mma in December (down from a recent peak of 38.8% in April) but the volume of sales has remained strong.
This suggests that it is still too early to know if policy restrictions introduced by a range of local governments are having a significant effect on the broader real estate sector – although recent price trends are encouraging.
China’s trade surplus narrowed again in December, with import values recording a stronger month-on-month increase than exports. Overall, the surplus was US$40.8 billion (compared with US$44.2 billion in November).
China’s imports rose moderately in December – up by 3.1% yoy to US$168.6 billion (compared with US$149.3 billion in November). This result was in line with market expectations, with respondents to the Bloomberg survey anticipating a 3.0% yoy increase.
Commodity prices have surged in recent months – contributing to the rising trend in import values. The RBA Index of Commodity Prices rose by 42% yoy in December, with coal and iron ore prices remaining elevated. In contrast, import volumes rose comparatively modestly, up by 1.2% yoy (according to China Customs data).
Despite easing policy measures that restricted domestic coal production (which led to global coal prices falling from recent peaks), coal imports remained strong in December – up 52% yoy. We expect imports to decline in coming months, as domestic shipments pick up.
Other key commodities exhibited mixed trends. Crude oil imports rose by 9.6% yoy, while both iron ore and copper imports fell in December – down by 7.6% yoy and 7.7% yoy respectively.
The value of China’s exports rose considerably month-on-month, to US$209.4 billion in December, but was well below the levels of a year earlier – down 6.1% yoy. This result was weaker than market expectations (at -4.0% in the Bloomberg survey), but may be subject to underlying data errors.
The confidence of exporters has remained relatively stable in recent months – with the new export order measure of the NBS PMI survey at 50.1 points (from 50.3 points in November) – a relatively neutral outcome.
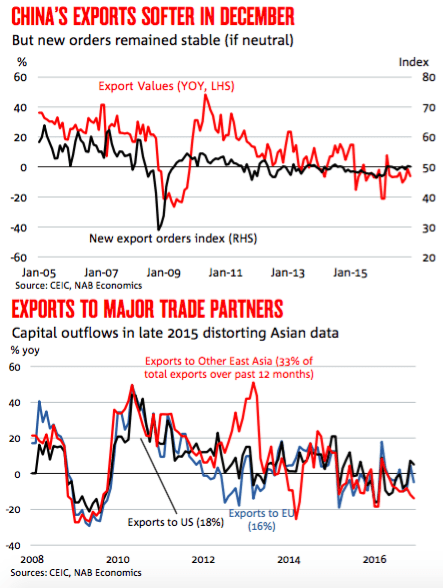
Once again, the trends for exports by major trading partners were quite mixed – with steep falls in Asia contrasting with growth in the value of shipments to the United States. Exports to the US rose by 5.1% yoy (compared with 7.3% last month). Exports to the European Union fell by 4.7% yoy, while the value of exports to East Asia dropped by almost 14% yoy.
Unauthorised capital outflows (disguised as trade flows) in late 2015 are distorting trade data. Exports to non-Hong Kong East Asia rose by 1.3% yoy in December, while exports to Hong Kong fell by over 26% yoy. The disparity between Hong Kong Customs and China Customs data was particularly stark in December 2015 – with Hong Kong reporting imports of just US$23.7 billion compared with China’s report exports of US$45.9 billion.
This discrepancy is larger than the year-on-year fall in exports for December 2016 – making underlying trends in trade flows extremely difficult to ascertain.
Growth in retail sales edged slightly higher in December – increasing by 10.9% yoy (compared with 10.8% previously). Retail price inflation has been moving higher in recent months – resulting in weaker growth in real sales. Retail prices rose by 1.5% yoy – unchanged from last month – meaning that real retail sales growth was 9.3% yoy in December (up from 9.2% previously).
Consumer confidence was marginally weaker in December – at 108.4 points (down from 108.6 points) however this remains well within positive territory, and well above the neutral levels recorded in the early part of 2016.
China’s headline inflation was marginally softer in December – with the Consumer Price Index increasing by 2.1% yoy (compared with 2.3%% in November).
Food price inflation was comparatively modest in December, with aggregate prices increasing by 2.4% yoy (down from 4.0% previously). This softer trend reflected much weaker price growth for fresh vegetables – at 2.6% yoy (compared with almost 16% last month).
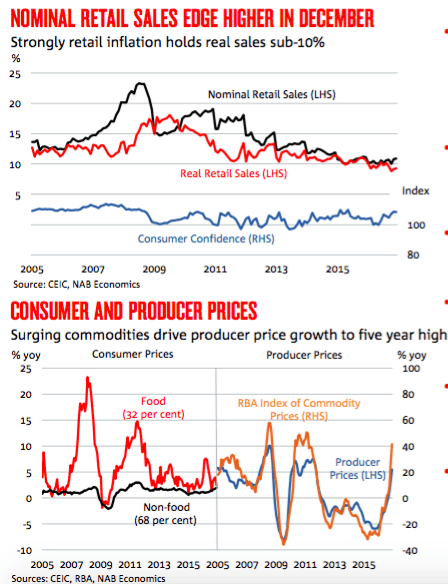
Non-food prices have continued to track higher in recent months, with prices rising by 2.0% yoy in December (up from 1.8% in November) – the strongest increase since November 2011. Fuel prices, utility costs and residence costs have all trended higher since the middle of the year.
Producer prices jumped in December – rising by 5.5% yoy (compared with 3.3% previously) – the strongest increase since September 2011. Commodity price trends had a major influence – with December 2015 marking the trough of the recent cycle. The RBA Index of Commodity Prices surged by 42% yoy in December (up from 27% in November).
China’s credit expanded strongly in 2016 – with new aggregate financing totalling RMB 17.7 trillion (an increase of almost 15% from 2015). This was the largest expansion on record (exceeding the previous peak in 2013). The largest share of new credit was issued in the first half of the year.
Bank loans accounted for around two-thirds of China’s new credit in 2016 – totalling RMB 11.9 trillion. This level was around 11.8% larger than the previous year. Almost 60% of new bank credit was issued in the first half, while Chinese firms continued to pay down foreign denominated debt across the year.
Major components of the shadow banking sector – trust and entrusted loans – accounted for the second largest share of new credit at just over RMB 3.0 trillion. There was strong growth in shadow banking loans – particularly in the second half of the year – following on from two years of weaker activity due to regulatory pressures.
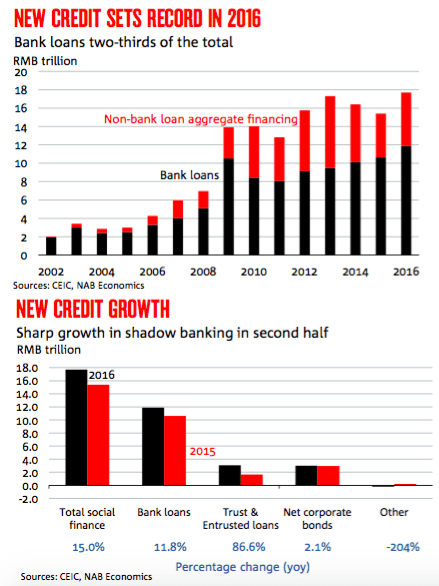
Corporate bonds also accounted for a significant share of new credit – at RMB 3.0 trillion, however growth in new net corporate bond issuance was minimal – at just 2.1% in 2016. While growth in corporate bonds was strong in the first half of the year, second half issuance was considerably weaker year-on-year.
Managing the growth of China’s already considerable debt pile – comparable to higher debt advanced economy levels – remains a key challenge for the Chinese authorities in 2017 and beyond.
Gerard Burg is an economist, on Asia, at the National Australia Bank.