
Resource states seeing healthier home prices: CommSec's Savanth Sebastian

GUEST OBSERVER
The housing market is certainly patchy across the nation, however it was encouraging to see some of the resource states seeing a decent lift in prices over October.
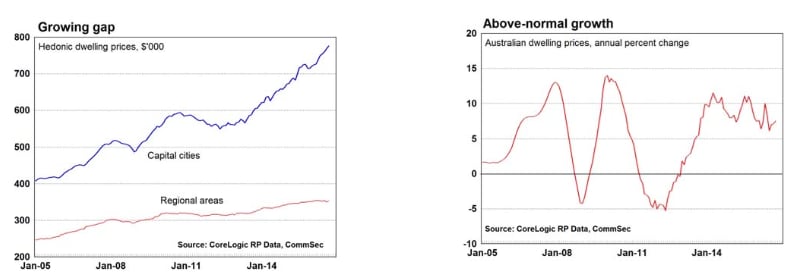
In addition prices fell in just two of the eight capital cities. Policymakers would be encouraged about more balanced home price growth across the nation but it would take a few more months to feel comfortable, and they would need to see a lift in regional house prices. Annual growth in home prices across regional centres was just 1.1 percent over the past 12 months.
What is clear is that prices are still rising in the strong markets of Sydney and Melbourne. In fact annual growth in Sydney home prices remains just shy of 11 percent and growth remains close to 10 percent in Melbourne.
Still, given the amount of new homes being built at present in Sydney and Melbourne, national home prices may slow over the coming year.
The latest home price data doesn’t stand in the way of the Reserve Bank cutting rates over the next couple of months. The Reserve Bank has regularly noted that housing supply will lift over coming years as work is completed on the bevy of new homes – especially apartments. On balance inflation will be more of a deciding factor when it comes to debating the merits of another rate cut.
The latest Australian manufacturing data is encouraging, suggesting that the current levels of interest rates and the Australian dollar are working in favour of domestic producers. No doubt the sector is also benefitting from the stronger demand now that Brexit and the Federal Election are out of the way.
What do the figures show?
Home prices
The CoreLogic Home Value Index of capital city home prices rose by 0.5 percent in October and was up 7.5 percent over the year.
In regional Australia, house prices rose by 0.9 percent in September and were just 1.1 percent higher than a year ago. (regional prices cover just houses and data is up to the end of September).
In capital cities, house prices rose by 0.5 percent in October while apartment prices rose by 0.6 percent. House prices were up 7.7 percent on a year ago and apartments were up by 6.3 percent.
The average Australian capital city house price (median price based on settled sales over quarter) was $615,000 and the average unit price was $520,000.
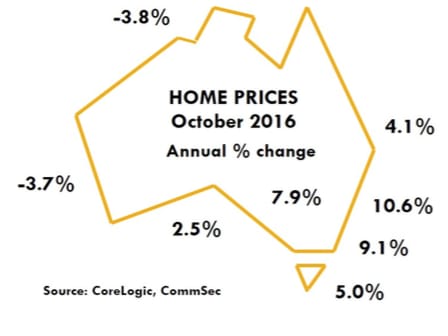
Dwelling prices rose in six of the eight capital cities in October: Darwin (up 2.2 percent) followed by Melbourne, Perth and Brisbane (all up 0.8 percent); Sydney (up 0.6 percent); and Canberra (up 0.4 percent). Prices fell most in Adelaide (down 2.4 percent), followed by Hobart (down 2.1 percent).
Home prices were higher than a year ago in six of the eight capital cities. Prices rose most in Sydney (up 10.6 percent); followed by Melbourne (up 9.1 percent), Canberra (up 7.9 percent); Hobart (up 5.0 percent); Brisbane (up 4.1 percent) and Adelaide (up 2.5 percent). Prices fell in Darwin (down 3.8 percent) and Perth (down by 3.7 percent).
Total returns on capital city dwellings in the year to October rose by 11.2 percent with houses up 11.3 percent on a year earlier and units up 10.9 percent.
Performance of Manufacturing
The Performance of Manufacturing index rose by 1.1 points to 50.9 in October. A reading above 50.0 indicates that the sector is expanding. The index had been above 50 for 13 months up until August 2016 – the longest period of expansion since September 2006.
AIG notes “The rise was driven by stronger growth in exports, sales and new orders, which highlights the growing importance of exports to manufacturers and suggests further growth ahead.”
What is the importance of the economic data?
The CoreLogic Hedonic Australian Home Value Index is based on Australia’s biggest property database. Unlike the ABS Index, which excludes terraces, semi-detached homes and apartments, the CoreLogic Hedonic Index includes all properties. Home prices are an important driver of wealth and spending.
The Australian Industry Group compiles the Performance of Manufacturing Index (PMI) each month. The Australian PMI is the Australian equivalent of the US ISM manufacturing gauge. The PMI is one of the timeliest economic indicators released in Australia. The PMI is useful not just in showing how the manufacturing sector is performing but in providing some sense about where it is heading. The key ‘forward looking’ components are orders and employment.
What are the implications for interest rates and investors?
Latest data shows that the Australian economy remains in good shape.
The transition from manufacturing to services in China is proceeding well. The manufacturing sector is tracking sideways while the services sector is taking up the slack and expanding nicely. A case of so far, so good.
Savanth Sebastian is an economist for CommSec
