Consumers less stressed about jobs, government policy and cost of living: NAB

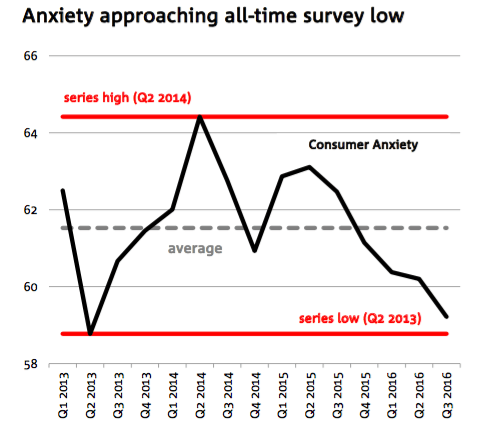
The NAB Consumer Anxiety Index fell to 59.2 points in Q3 2016 (60.2 in Q2 2016) to its lowest level in more than 3 years.
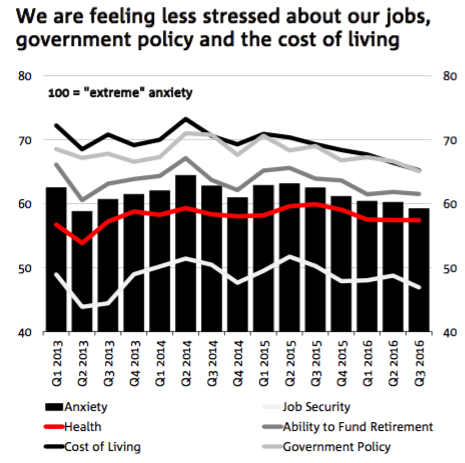
According to NAB Group Chief Economist Alan Oster consumers felt less stressed about their jobs, government policy and the cost of living, with anxiety related to their health spending and retirement funding unchanged.
The cost of living, along with government policy, is still the biggest driver of overall consumer anxiety. But with low inflation persisting, cost of living anxiety fell to its lowest level since the Survey began in early 2013.
“It was pleasing to see just 1 in 4 Australian consumers now reporting “high” anxiety over their cost of living, compared to more than 1 in 3 in mid-2014” said Mr Oster.
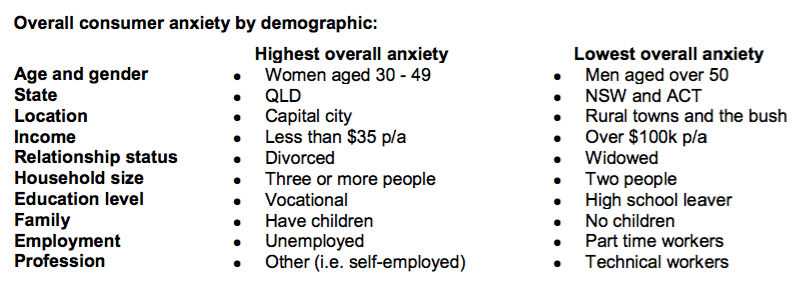
By state, consumer anxiety was highest in Queensland and lowest in NSW and Victoria.
Women were far more anxious than men, particularly those aged 30-49 who were also the most anxious across all demographic groups.
“Women reported higher stress for all drivers of anxiety, especially when it came to their retirement funding and the cost of living, and women aged 30-49 were also one of the very few groups still reporting above average levels of anxiety” said Mr Oster.
Despite lower levels of overall anxiety, consumer spending behaviours are still very conservative and dominated by spending on “essentials” such as paying down debt, utilities and medical expenses.
“On a positive note, however, we have loosened our purse strings a little with fewer consumers cutting back on non-essential spending” said Mr Oster.
Australians were also less anxious in regards to their current financial position, with all drivers of household financial stress causing less concern.
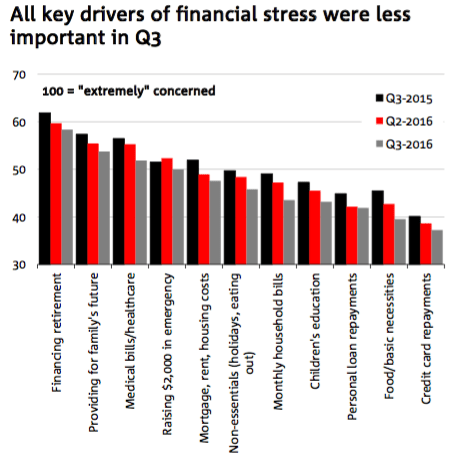
Financing retirement, providing for our family’s future, health expenditure and the ability to raise emergency funds remain the biggest drivers of financial stress.
In an attempt to measure financial resilience, Australian consumers were asked for the first time to rate how well they have been able to cover their basic living expenses and any unforseen financial expenses such as a major home or car repair in the last 12 months.
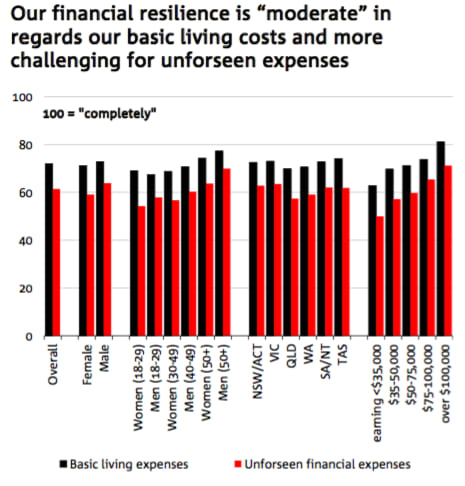
Australian consumers believe they are only “moderately” placed to cover their basic living expenses.
“Men were better placed than women in all age groups to meet their basic living expenses and unforseen expenses. Having a higher income also helps a lot” said Mr Oster.
Looking forward, NAB expects moderate but easing household consumption growth over the next few years, with real household consumption growth forecast to average around 2.7% for 2016, before slowing to 2.1% in 2017 and 2.3% in 2018.
Consumer Behaviour Survey Q3 2016
Consumer anxiety fell again in Q3 and we are worrying less about the cost of living. We are still spending conservatively, although there were signs our purse strings loosened. We were less anxious about our current financial position, with all drivers of household stress causing less concern. But we rate our financial resilience only “moderate” when it comes to our ability to meet life’s expenses.
Consumer anxiety falls to its lowest level since mid-2013
Australian consumers are becoming less anxious, with NAB’s Consumer Anxiety Index falling to 59.2 points in Q3 2016 (60.2 in Q2 2016). The index currently stands at its lowest level in more than 3 years and is down from a survey high 64.4 points in mid-2014.
NAB consumer anxiety trends
Lower consumer anxiety in Q3 2016 was underpinned by reduced concerns relating to our job security, government policy and the cost of living. Anxiety levels related to our health spending and ability to fund our retirement were largely unchanged.
Notwithstanding recent improvements, the cost of living and government policy continue to be the biggest drivers of our consumer anxiety.
NAB consumer anxiety index
However, we are continuing to see some very encouraging improvements in anxiety stemming from our cost of living, which has now fallen to its lowest level since the survey began in 2013. Indeed, just 1 in 4 (25%) Australian consumers are now reporting “high” anxiety over their cost of living, down from just over 37% (more than 1 in 3 consumers) in mid-2014.
But consumer anxiety continues to vary widely across demographic groups. Overall, it was highest in Q3 for middle-aged women (65 points), divorced Australians (63 points) and the self-employed (61.9 points). It was lowest for men over 50 (54.4 points), the highest income earners (55.3 points), young men (55.6 points) and widows (56.1 points).
By state, anxiety was highest in Queensland (60.1 points), where cost of living concerns were notably above all other states and in SA/NT (59.9 points) and WA (59.8 points) where stress relating to job security played a bigger role. Not surprisingly, consumer anxiety was lost lowest in NSW/ACT (58.5 points) and Victoria (59 points) - where economic growth is also leading the country.
Consumer anxiety was also a much bigger issue for women (61.7 points) than for men (56.7 points) - and across all age groups - with women also reporting notably higher stress across all key drivers, especially in relation to their ability to fund their retirement and cost of living.
Consumer anxiety by group
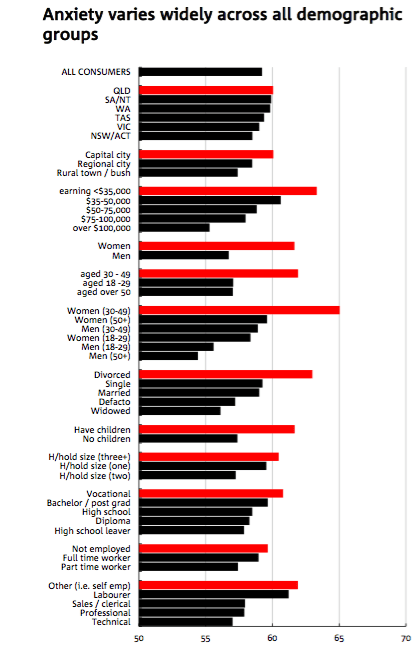
It was also noticeable that middle-aged women, consumers living in Tasmania, and those that are self- employed were the only groups still reporting above average levels of anxiety - and in all cases due to above average stress relating to their jobs, health expenditure and ability to fund retirement.
Our spending behaviours
Despite falling levels of consumer anxiety, changes in consumer spending patterns remain largely conservative.
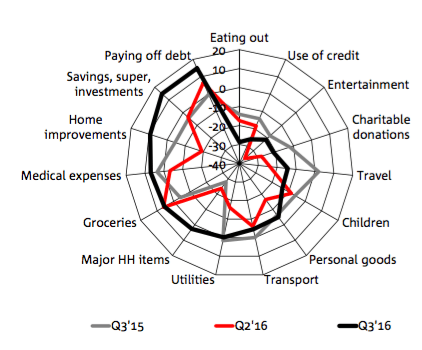
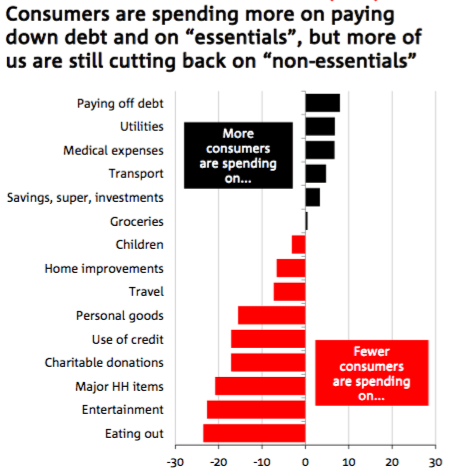
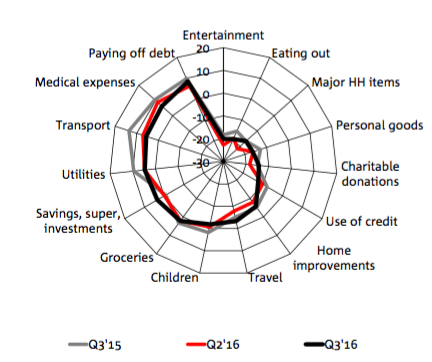
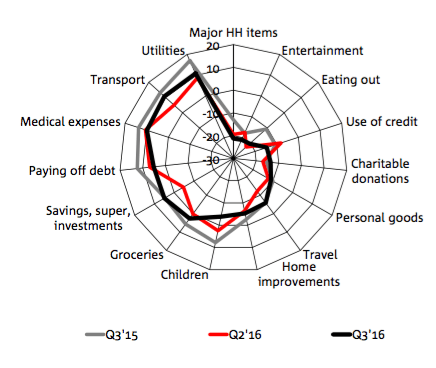
In Q3, more Australians increased their spending in relation to paying down debt. More Australians also increased their spending on utilities, medical expenses, transport and they added to their savings, superannuation and investments.
In contrast, more consumers in net terms are still cutting their spending on “non-essentials”, particularly eating out, entertainment, major household items, charitable donations and credit use.
Spending behaviours in Q3 (Net)
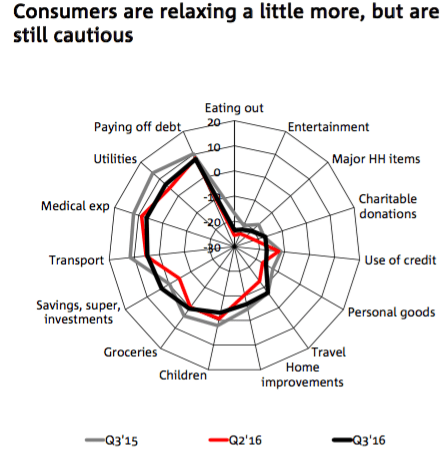
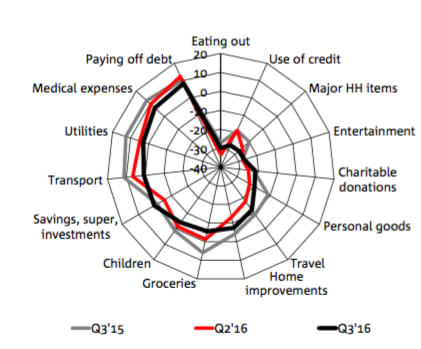
On a more positive note, the chart below shows that fewer Australian consumers increased their spending on “essentials” over the past year, while fewer of us also cut back on many “non-essentials”.
However, our overall spending behaviours remain very conservative and we are cutting back where we can. This pattern is also broadly consistent across most states (see State Spending Behaviours below).
Changes in spending behaviour (Net)
How our spending is changing
Another way to show consumer spending behaviour is by grouping all “non essentials” (entertainment, eating out, major household items, home improvements, personal goods and travel), “essentials” (medical, utilities, transport, groceries and children) and “financial spending (paying off debt, savings/super/investments and use of credit).
Consumer behaviour by type of spending
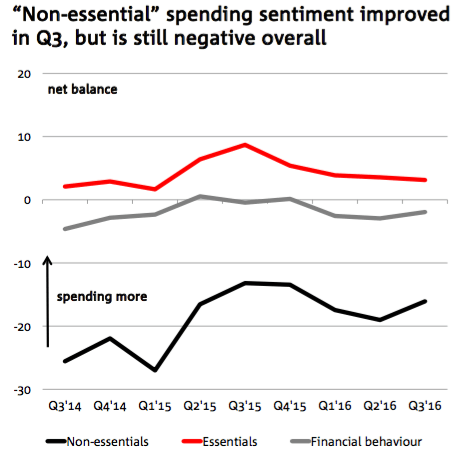
Our spending behaviours in relation “essentials” and our financial behaviour were largely unchanged in Q3. But “non-essential” spending sentiment (a broad proxy for consumer confidence) improved to -16, its highest reading since Q4 2015.
Our current financial position
We were less anxious overall about our current financial position in Q3 (63.1 points). But this varied according to where we lived, our age and gender.
NSW/ACT (60.2 points) was the least anxious state and Queensland (64.7 points) the most anxious. SA/NT (61.9 points) was the only state to report higher anxiety over their current financial situation.
Anxiety over our financial position
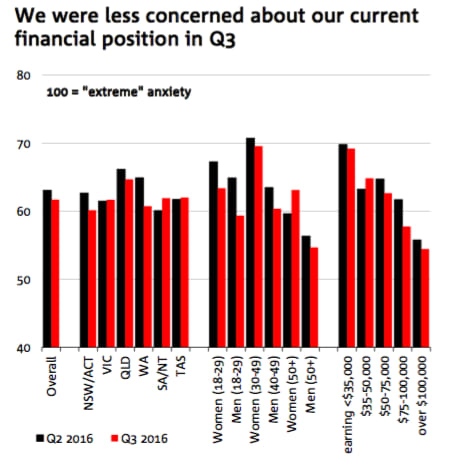
Men over 50 (54.7 points) reported the lowest anxiety in relation to their current financial position. Middle aged women (69.6 points) were the most stressed, while women over 50 (63.1 points) were the only group to report higher anxiety in Q3.
Not surprisingly, there was a clear relationship between financial stress and income, with stress levels considerably lower in the highest income group (54.5 points) compared to the lowest income group (69.2 points).
All drivers of household financial stress causing less concern
Reduced stress over our current financial position in Q3 was supported by lower concern over all key drivers of household financial stress.
However, we continue to identify financing retirement, providing for our family’s future, health expenditure and our ability to raise emergency funds as the biggest drivers of financial stress, but somewhat less so than in the previous quarter and notably less so than at the same time last year.
Drivers of financial stress
Financial resiliance - our ability to cover life's expenses
Australian consumers were asked for the first time how well they have been able to cover their basic living expenses and any unforseen financial expenses (such as major home or car repairs, major illness, funeral or wedding expenses, birth of a child etc.) in the last 12 months - essentially how financially resilient do they think they are.
Australian consumers believe they are only “moderately” placed to cover their basic living expenses (72 out of 100 where 100 = “completely” resilient). Their ability to meet unforseen financial expenses is even lower (61.4 points) and across all key demographic groups.
But men were better placed than women (in all age groups) to meet both their basic living expenses and unforseen expenses. Having a higher income also helps a lot.
Interestingly, consumers in Tasmania rated highest for their ability to meet their basic living expenses (ahead of Victoria and SA/NT), while consumers in NSW/ACT and Victoria were best placed to meet unforseen financial expenses. Low income earners struggled most with unforseen expenses.
Ability to cover our living costs
The view from NAB economics
Household consumption appeared to have lost some momentum in recent quarters, possibly reflecting the slowdown in the labour market since late last year, as well as persistently soft wages growth consistent with compositional shifts in the labour market towards part-time jobs which tend to be lower-paid.
The Q2 National Accounts revealed a relatively soft household final consumption expenditure result of 0.4% q/q, with slowing retail spending causing a more apparent drag on overall household spending activity. That said, the broader trend of services consumption outpacing goods consumption continued, with health, hospitality and financial services being the largest contributors in the quarter.
Meanwhile, higher frequency data such as the official ABS retail trade data, our monthly NAB Online Retail Index and NAB Business Survey pointed to further softening in sales and conditions in the retail sector in recent months.
A stabilisation in the household saving ratio at around 8% - a level higher than the trough reached in Q4 2015 of 7.5% - suggests a return of consumer caution which could weigh on household spending in the near-term.
While clearly more downside risks to the consumption outlook have emerged from the above factors, they should be partly offset by the positive impetus stemming from a sustained low interest environment and renewed strength in house price growth, especially in Sydney and Melbourne.
We now expect moderate but easing household consumption growth over the next few years, with real household consumption growth forecast to average around 2.7% for 2016, slowing to 2.1% in 2017 and 2.3% in 2018.
Spending behaviours by state
New South Wales/ACT
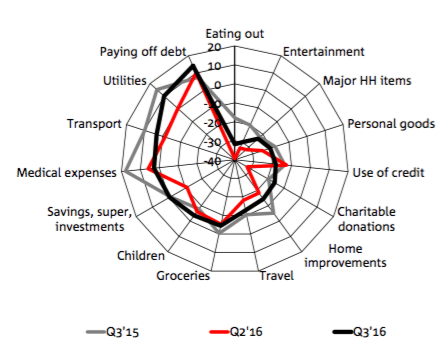
Spending behaviours in NSW/ACT were largely unchanged in Q3. There were some cutbacks in medical, transport and credit use, but more consumers increased spending on major household items, travel, charity and saved more.
Victoria
Notably more Victorian consumers increased their savings, super and investments and spent more on transport and travel in Q3. In contrast, cutbacks were most apparent in regards to their credit use, spending on children and entertainment. Most other areas of spending were broadly unchanged.
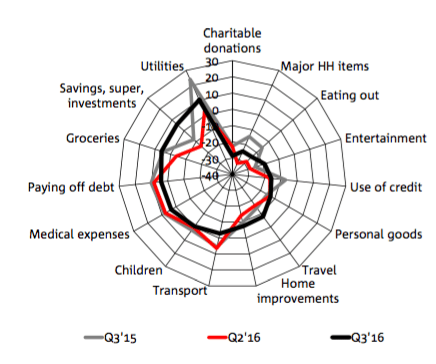
Queensland
Fewer consumers in Queensland increased their spending on “essentials” in Q3, particularly in regards to transport. A lot more consumers also cut back on their use of credit, but they more added to their savings, superannuation and investments.
In contrast, more consumers spent on “non essentials”, particularly home improvements, travel, eating out, charitable donations and personal goods. The number of consumers in Queensland that have cut back their spending on “non-essentials” over the past year is also noticeably lower.
Western Australia
More consumers in Western Australia increased their spending across most categories in Q3 2016. In particular, there were some big increases in the number of local consumers spending more on charitable donations, their savings, superannuation and investments and on utilities relative to the last quarter. Spending fell in just 2 areas - credit usage and on medical expenses.
South Australia
Spending behaviours in South Australia in Q3 were dominated by big increases in the number of consumers saving more and spending more on groceries and utilities, but also by notable increases in the number spending more on “non-essentials” such as entertainment, travel and major household items. Fewer consumers increased spending on transport, charitable donations, medical and paying down debt.
Tasmania
Spending behaviours in Tasmania remain volatile. In Q3, they were dominated by large increases in the number of consumers spending more on home improvements, major household items, their savings, utilities, personal goods and medical. Fewer consumers increased spending on eating out and their children or used credit.