
With a low cash rate, equities and property are important for any long-term savings plan: Christopher Joye

What are your two biggest challenges when saving? Arguably capital preservation and generating long-term, “after inflation” returns in the order of 3% to 5% per annum. What is inflation? Simply, the periodic increase in the cost of the goods and services that you buy. If inflation rises faster than your income (and/or your investment returns), your purchasing power is not keeping pace with your cost of living. Are your living expenses different to the official inflation rate calculated by the national statistician? You bet, which makes evaluating your actual purchasing power more complicated.
In my first chart below I have compared the official inflation rate with four “cost of living indices” published by the Australian Bureau of Statistics. These indices cover, respectively, “employees”, “aged pensioners”, “other government benefit recipients”, and “self-funded retirees”. The black dotted line is the inflation rate.
Click to enlarge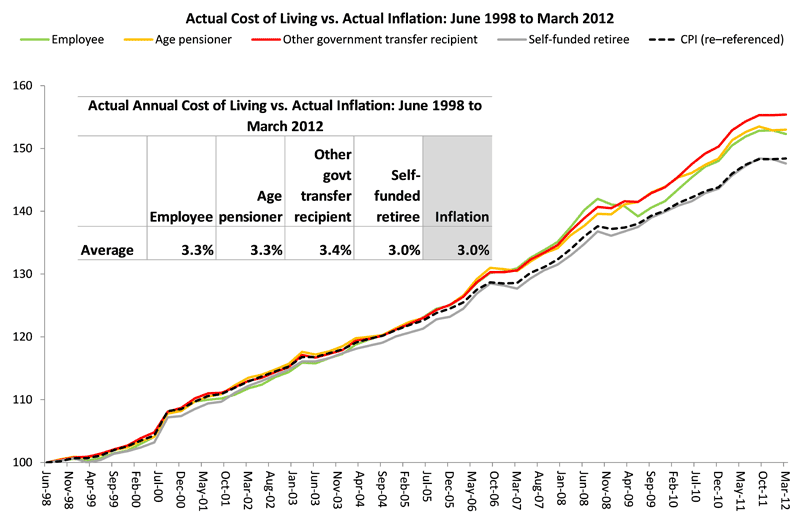
As you can see, our cost of living has generally appreciated more rapidly than the headline inflation numbers (observe how three of the four cost of living indices are above the black dotted line). While the inflation rate since 1998, which is when the cost of living measures start, has averaged about 3% per annum, employees, pensioners and other welfare beneficiaries have seen their living expenses accrete by between 3.3% and 3.4% per annum. Over time, this wedge compounds up into significant differences. Only self-funded retirees have had their living costs track inflation. It is worthwhile adding here that the 3% annual inflation rate recorded over the 1998 to 2012 period is hardly comforting (underlying inflation estimates are similar): in particular, it is way above what most OECD nations regard as acceptable.
The key thing to take away from this analysis is that you need to punch out consistent returns of 3-4% per annum from your savings just to keep pace with the rise in the price of the goods and services you need to buy to survive.
The bad news is that doing so in the current environment, which is characterised by global “deleveraging” (i.e., higher savings and, where possible, reduced indebtedness) is bloody hard. Central banks around the world have cut interest rates to near-zero, which means that in the UK, North America, and Europe savers are going backwards on their cash accounts once they account for inflation.
In Australia the situation is only a little better. In my next chart I have illustrated both the “average” bank deposit rate, which is the red line that refers to the right-hand-side axis, and the return you get on the average bank deposit after paying living expenses (the yellow bars that relate to the left-hand-side axis). Here I’ve assumed that you are an “employee”, as defined by the ABS.
Click to enlarge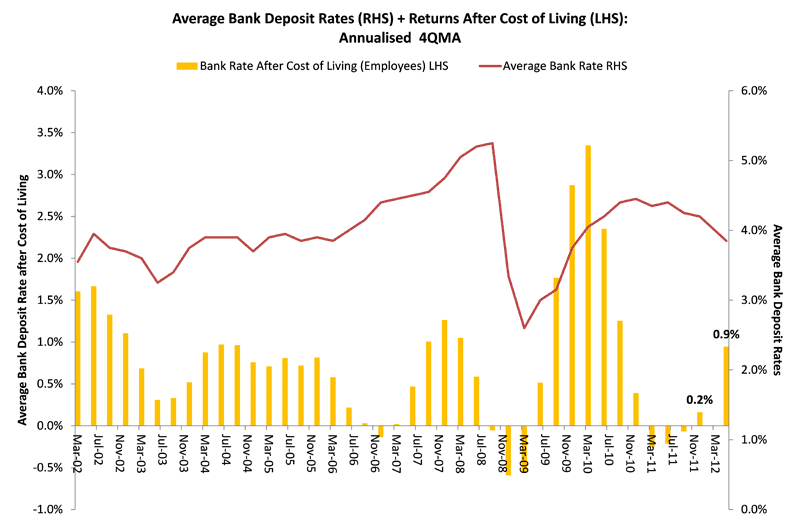
As you can see from the yellow bars, the “real” return you get on the average bank deposit has been very low since the start of 2011. While you can currently get a 1% annual return above the cost of living, this is being driven by the decline in inflation recorded in the second half of last year and the first quarter of 2012. That reduction was in turn an artefact of the sharp appreciation in the Aussie dollar, which is now being reversed. The likelihood of higher cost of living rates in future quarters (compared to the recent past) combined with declining returns on bank deposits means that real interest rates are likely to once again converge towards zero, and possibly turn negative.
More on page 2
What about those “special rates” you can get with the banks? In my third chart I have repeated the analysis above using the RBA’s “special” bank rate series. After living costs, real special deposit rates are currently a little higher at circa 2% per annum. But they were much lower in 2011 and the risk is, as I just noted, that they fall towards zero again.
Click to enlarge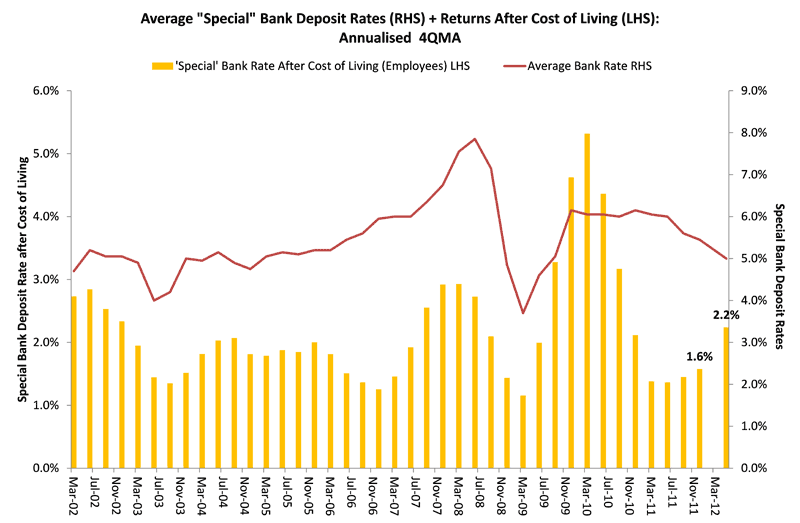
So if we can only earn at best 1-2% per annum above living costs via the banks, what other options do we have? Today I want to have a think about equities and property.
As you probably know, the share market has been horrifically volatile in recent times, and has delivered negative total returns – before subtracting cost of living increases – over the last one to two years.
Nevertheless, equities do have an important role to play in any long-term savings plan. The emphasis here is on “long term”, because even the most diversified equities portfolio can have its value halved in the short term.
What should our return expectations for equities be? It’s a hard question to answer. Let’s start off by thinking about what we mean by “equities”. A well-diversified equities portfolio simply gives you an ownership stake in a large chunk of corporate Australia. Of course, there are also many private companies and small businesses that are not listed on the ASX, and which you will not, therefore, have exposure to.
The “enterprise value” of any company is the sum of its debt (i.e., loans from the bank and bonds it issues) and equity (i.e., the amount you invest to own part of it). If economic growth, or GDP, is defined as the market value of all economic output, it is hard to imagine how the enterprise value of corporate Australia can grow much faster than nominal GDP.
Trend “real” economic growth is thought to be around 3% to 3.25% per annum. Long-term inflation averages about 3% per annum. So a long-term nominal economic growth forecast might be circa 6% per annum. Should your expected total return for Aussie shares be the same? No, because if companies are funded using debt and equity, the equity returns should be higher than the sum of the debt plus equity (or the company’s total enterprise value).
Over the last 30 years, Aussie shares have given total returns of about 11-12% per annum, which has been significantly higher than economic growth. But remember that these high returns come with high risk (i.e., the probability of loss). Think 40-50% falls in the value of Aussie shares in 1987 and 2008.
What about residential property? There is much overlooked nuance associated with investing in housing. Let’s repeat the first principles approach I used for shares.
It is hard to see how the overall value of housing can increase more quickly than household purchasing power, all things being equal. So a good benchmark for capital gains is probably disposable household incomes. For a bunch of reasons, these will probably grow at about 4% to 5% per annum over the next decade. But this does not sound especially exciting; i.e., house price growth a tad above inflation.
Then, of course, we have rental income in the same way we get dividends from shares. The current gross yield on Australian capital city apartments is about 5% per annum (and rising). So your total gross expected return from investment property might be 9% per annum over the next decade.
Despite the baloney about housing being a tax-advantaged asset-class, the taxes and transaction costs associated with buying and selling housing in Australia are heinously expensive: the IMF figures about 12% round-trip. Amortised over your average seven- or eight-year holding period this is going to knock 1.5% per annum off your total returns. So maybe you get, on average, 7.5% per annum net, over the cycle. Not a bad real return assuming inflation runs at 3%.
Now here is the rub. Your actual “equity” returns are usually much higher than this. Like most companies, homes are funded by debt and equity. The average initial gearing on a home is about 80%, while the average gearing on an existing Aussie home with debt outstanding is about 45%. (Think about it: when you buy a $500,000 home with a $100,000 deposit you are geared 80%.)
There are three attractive things about housing leverage: first, you can get much higher leverage than almost any other asset-class (i.e., the bank will lend you up to 95%); second, residential home loans are the cheapest form of debt you will find (cf. small business loans, corporate loans, or personal loans); and, third, the term of the debt – up to 30 years – is longer than the gearing available to other investments.
A final wrinkle with residential real estate is that the risk of investing in an individual home is far greater than most people realise. In fact, Rismark estimates that the volatility of a single family home is akin to the volatility of the share market.
Accordingly, the best possible residential property investment would be a product that allows you to invest in a portfolio of thousands of individual homes to give you the diversification you need to reduce risk. A nationally diversified residential property index has very low volatility of about 5% to 6% per annum (compared with the 15% to 20% per annum of the ASX All Ordinaries Accumulation Index). Leveraging up against this would be safe: gearing against an individual home is a far more hazardous exercise.
Christopher Joye is a leading financial economist and a director of Yellow Brick Road Funds Management and Rismark. The author may have an economic interest in any of the items discussed in this article. These are the author’s personal views and do not represent the opinions of any other individual or institution. This material is not intended to provide, and should not be relied upon for, investment advice or recommendations.

