Stand by for world's first daily house price index: Christopher Joye
Covered bonds are a fancy new funding instrument being promoted by the major banks – and notably only the majors – that were championed by Wayne Swan and Joe Hockey as a policy to enhance competition in the banking and finance sectors. As predicted by some, they seem to be benefiting the incumbents most.
Covered bonds have one significant impact that arguably disadvantages all Australians with a bank account. In the past, when you put your money with the bank, you were the first person who was paid back if the bank went belly-up. And banks do go belly-up. In the 1890s, about 90% of all private Australian banks collapsed. More recently, we have seen hundreds of banks fail around the world, including in once-stable developed countries like the US and UK. Australia’s turn could come when a financial crisis eventually originates out of Asia, which it inevitably will.
An investor in a covered bond gets a priority claim over the bank’s assets, which ranks ahead of your deposit. Specifically, the major banks will set aside individually up to $30 billion plus worth of their home loans in order to “secure” their covered bonds. That means if the bank falls over, the covered bond investors can take possession of the underlying home loans and sell them to repay what they were owed by the bank via the bond.
Since covered bonds are being backed by residential home loans, investors are understandably turning their minds to the quality of these loans, and the integrity of Australia’s housing market more generally. Given our expertise in both these areas, we have been inundated by enquiries from institutions around the world. In fact, I am presenting to a group of global hedge funds on this subject at 12.30pm today.
The majors have decided to “mark-to-market” the assets (or “collateral”) securing their covered bonds using house price indices. This makes a great deal of sense. If Australian house prices are falling (as they are currently), then the value of the assets underpinning a covered bond is also declining. (It is actually a little more complex than this, and perhaps best characterised as the asset having a “higher level of risk of loss” in view of the lower level of borrower equity sitting above the loan.) This creates immediate problems for investors, since the protection they have in a crisis is less than what they expected to be the case.
Regularly revaluing the homes underlying a covered bond on a high-frequency – say monthly – basis is likely to be especially important to investors since:
(1) house price indices are reported with a lag (up to four months in the case of the quarterly ABS index); and
(2) in any fast-moving crisis that involves a bank failure, house prices are almost certainly likely to be falling too. You don’t want to have to wait four months to work out how much your collateral values have declined by (or by how much you risk exposures have risen)!
I understand that most of the major banks have selected RP Data-Rismark’s monthly hedonic index as their valuation benchmark of choice for the purposes of covered bonds.
This is not a surprise given that the Reserve Bank of Australia has made it clear that it relies on this index most heavily when assessing risks in Australia’s controversial housing market (see also here for independent remarks from CommSec, Moody’s, Goldman Sachs, and Macquarie). Or, to borrow the words of Westpac’s chief economist, “RP Data-Rismark are the RBA’s “preferred data analysts' for house prices.”
Another alternative would have been to use Australian Property Monitors’ (APM) “stratified median” index, which the RBA employs as a back-up to RP Data-Rismark.
A final, least desirable, option is the ABS’s stratified median house price index, which has been regularly discredited by market analysts and more subtly dismissed by the RBA.
From a covered bond investor’s perspective, the choice of house price index is likely to have major consequences for (1) how accurately the covered bond assets are valued, (2) how frequently investors get revaluations, (3) the speed with which they can replace assets that are determined to be “impaired”, and, most importantly, (4) the pricing of the covered bond itself.
If a home loan is in default, repaid, or if the value of the home securing the loan is less than the loan amount itself (i.e., the borrower has negative equity), covered bond investors usually require that the issuing bank replaces these “bad” loans with “good” ones.
Since covered bonds are expected to be AAA-rated securities, this seems like a reasonable demand.
A $1 billion covered bond will probably have about 5,000 residential dwellings underpinning it. One problem with the ABS index is that it excludes 20% to 25% of all property types in Australia. Specifically, the ABS index only includes “freestanding houses”, and ignores all apartments, units, semi-detached homes, terraces and so on.
About one-quarter of all home loan borrowers live in these “attached” dwellings. Given the sometimes wide divergences between the gains and losses attributed to free-standing houses versus apartments, use of the ABS numbers as a mark-to-market tool is likely to generate misleading results in the context of covered bonds backed by home loans.
In contrast, both APM and RP Data-Rismark’s indices include all dwelling types, which is why they deviate so significantly from the ABS results on occasion (the RBA prefers that we report these “all dwelling” figures).
A second problem with the ABS index is that it is only reported at the “capital city” level. To properly mark-to-market a portfolio of 5,000 homes, one should really be using postcode or regional house price indices to minimise the substantial “basis risks” that would otherwise exist between the index and the home. For example, about 2,000 properties will, on average, be situated in NSW. But within the state of NSW there are huge differences in the rate of house price change across regions.
One only needs to reflect on the example of southwest Sydney in the post-2003 period. This region accounted for an extraordinarily high share of all mortgage defaults across Australia (some estimates put it at over 75%), and experienced substantial house price declines. In comparison, many other areas within Sydney had low default rates and steady house price growth. Benchmarking using a capital city index would have underestimated the southwest Sydney problems.
A third issue with the ABS index is the fact that it is reported on only quarterly basis, and then one month following the end of the subject quarter. This means that the sales data upon which it is predicated can be up to four months old.
As I noted earlier, investors in covered bonds are likely to be most concerned about collateral values during a crisis. Any stress imposed on Australian banks, which on average have 60% of their assets invested in residential home loans, is likely to have been either caused by, or precipitate itself, substantial house price declines. This is precisely why in APRA’s stress-testing of bank balance sheets it assumes that Australian house prices fall by about 25%.
In such situations, investors are presumably going to demand the most timely pricing information possible so that the bank in question can remove the impaired assets from its covered bond portfolios. It is hard to see how this could be achieved with the ABS’s current reporting frequency. The monthly house price proxies made available by RP Data-Rismark, APM or even Residex are likely to be a superior alternative.
On this note, RP Data and Rismark will be shortly launching the world’s first “daily” house price index, which has been designed especially for the Australian Stock Exchange. This index, which is based on a sophisticated statistical method known as “hedonic imputation”, will afford extremely accurate and low variability house price estimates right down to the suburb level. It will be the first time in history that all homes in a suburb have been repriced every single day using the daily flow of incoming sales data.
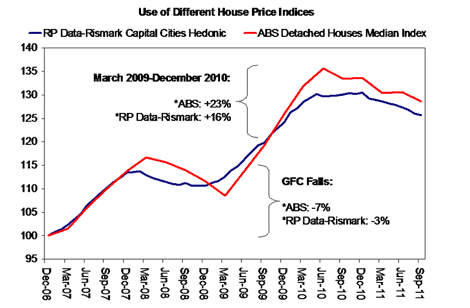
How big can the differences between indices really be? In the chart below I have overlaid the ABS national capital city index against RP Data-Rismark’s equivalent measure.
Click to enlarge
Observe how in the global financial crisis the ABS’s crude median index reported substantially lagged house price declines that were also twice as large (-7%) as those documented by RP Data-Rismark’s regression-based benchmark (-3%). The same was true during the 2009-10 period, when the Australian housing market bounced back strongly and banks like CBA came in for criticism for having excessively large exposures to the first time buyer market. (They ended up using some of our analysis to refute this claim!)
According to the ABS measure, house prices inflated 23% between March 2009 and December 2010. Once again, the ABS numbers were reported with a material delay. Yet the month-to-month RP Data-Rismark index only recorded 16% growth. Anyone investing in a covered bond in March 2009 would have been led to believe that they had superior collateral protection than was actually the case had they been relying on the ABS.
The confusion that could be potentially caused by house price measurement problems in the covered bond market is graphically highlighted by a “Covered Bond Primer” published by the CBA.
Like every other major bank and investment bank in Australia, CBA’s economists have expressed reservations about the biases inherent in the ABS house price proxy.
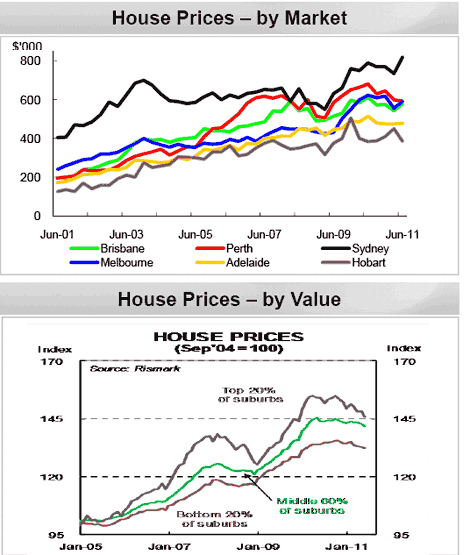
Notwithstanding this, on page 17 of CBA’s covered bond primer, the bank appears to have unwittingly presented data from both the ABS and RP Data-Rismark. I have enclosed this image below.
The very wobbly lines in the first chart are from the ABS’s non-parametric median price index. The second chart is a replica of a similar diagram regularly reported by the RBA, and is, of course, prepared using RP Data-Rismark’s hedonic index.
Covered bond investors are likely to be best serviced by common valuation benchmarks. In the absence of a consistent standard, investors may price at a discount covered bonds relying on less accurate house price information relative to those that are valued using the best available data. And since the major banks expect to eventually issue close to $100 billion worth of covered bonds, seemingly small differences in the rate at which house prices are expanding or contracting could perpetuate substantial dollar value variations in covered bond prices, to say nothing of all-important investor perceptions.

Christopher Joye is a leading financial economist and a director of Rismark International and Yellow Brick Road Funds Management. The above article is not investment advice.

