Owner-occupied housing top-performing asset over 24 years, but not in the next decade: ANZ
Residential property was the highest-returning asset over the past 24 years, according to research by ANZ Bank. For an investment of $100,000 in 1987 into an owner-occupied house you would have a return of $1,428,000 today for the same initial investment.
For an investment of $100,000 in 1987 into investor housing, you would have a final return of $810,000 today.
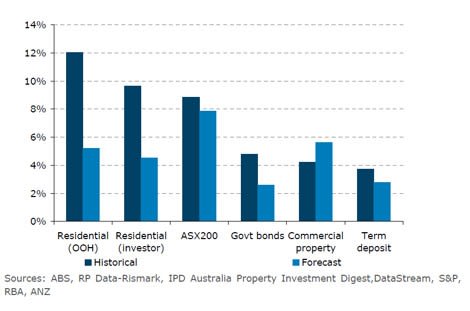
“Even when costs and taxes were factored in, owner-occupied housing generated 12% annual returns – the highest of six asset classes with – investor housing next best at 9.6% annual returns and then equities at 8.9%,” the report says.
The study reviewed the after-tax and after-cost returns of the major investment asset classes: owner occupied housing, investor housing, commercial property, equities (the ASX 200), government bonds and term deposits, the weakest performer.
The base date for the analysis used was March 31, 1987, the earliest possible date where all of the required data was available.
Comparison of historical and forecast average annual returns (after costs, taxes and gearing)

It notes retail property outperformed office and industrials by a strong margin given the two segments experienced marked downturns from 1990 to 1994 resulting from the early ‘90s recession and associated high vacancies.
The most significant factor in owner-occupied housing’s top ranking was its exemption from capital gains tax.
While noting both owner-occupied and investor housing indexes generated higher returns at a lower risk than equities, the ANZ forecast equities would be the strongest performer over the next 10 years, with a forecast 8% average annual return.
Commercial property with 5.8% annual returns is predicted to show strong returns over the next decade, sitting between equities and owner-occupied housing at about 5.3% forecast annual returns.
“Equities will be the highest-returning asset in the decade ahead (after costs, taxes and leverage), despite commercial property having the highest assumed raw total returns,” the ANZ report predicts.
“Commercial property produces large cash flows which are taxed at the full marginal tax rate.
“Equities, however, are assumed to deliver a higher proportion of its returns through capital gains, which are only taxed at half of the marginal tax rate.
“Higher stamp duties reduce property returns,” it notes.
It notes commercial property’s past weak performance was largely due to very weak returns rather than volatility.
The report warns that the forecast model is very sensitive to assumptions. It assumes that housing prices will rise by 5% per year over the period, in line with expected growth in average household incomes.
It also assume no structural shift in interest rates for the next 10 years. It assumes rental yields for housing converge to 3%.
The ASX 200 is assumed to have a gross (adding back franking credits) return of 9%.
The report notes diversification in property is more difficult than in stocks, due to the higher entry level for individual assets.
“Concentration risk is more of an issue for property investors,” the report notes.
A very important assumption made was that owner-occupied housing earns imputed rent, and that this is not subject to tax.
“Imputed rent is an implied form of rent that reflects that the investor no longer has to pay rent for somewhere to live,” it notes.
Maintenance costs were assumed to be 1.2% of the value of the property for owner-occupied housing, such as council and water rates, insurance, plumbing and general maintenance.
Maintenance costs for investor housing were assumed to be 1.8% of the value of the property given the extra costs such as advertising, GST on fees, real estate fees and management fees.
A gearing level of 50% was assumed for all assets, except for term deposits and government bonds.
Government bonds and term deposits were excluded from leveraging, as their effective total return level is always less than the debt rate, so leveraging would result in lower returns.
Returns were measured based on the return on equity.
The upward effect on returns from property owners renovating and improving properties was not accounted for in this analysis.
Finding data on the cash yield and capital growth for each asset was critical in calculating after tax returns.
This was particularly the case for assets that produce large cash flows that are taxed at the full marginal income tax rate, while assets that create returns through capital gains are taxed only at half of the marginal income tax rate (assuming the asset has been held for at least one year).
The S&P ASX200 total return index provides information on average dividend yields and capital price growth.
In order to try to estimate the benefit of franking of dividends, the average amount of franking credit paid was assumed to be equivalent to a frankable company tax rate of 27%.
This is the average that was issued by the SPDR S&P ASX 200 index tracking fund since mid-2002, when the company started reporting.
The average coupon rate and price growth for a portfolio of Australian government bonds were tracked using the Datastream Government Bond Index (all maturities).
Both the ABS and IPD data provide information on capital price growth and rental yields for each quarter.
