Hobart houses and units continue to linger on the market: RP Data
Hobart houses and units continue to spend the most time on the market, according to an RP Data report for the week ending June 9.
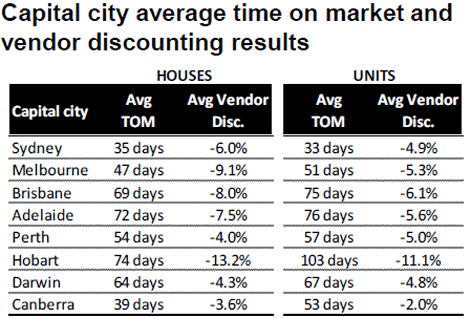
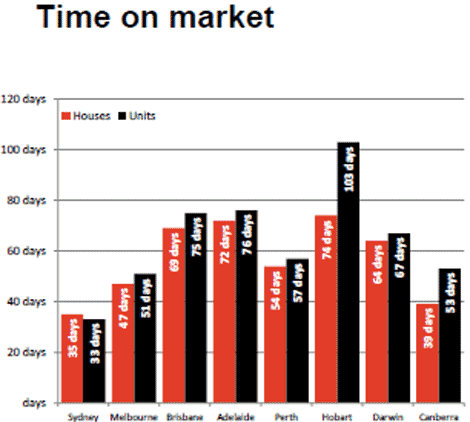
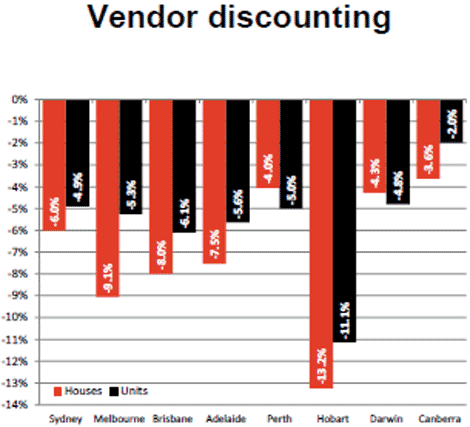
Hobart houses spend an average of 74 days on the market and offer the largest average vendor discount of 13.2%.
Hobart units spend an average of 103 days on the market and offer an average vendor discount of 11.1%.
Sydney houses spend the least amount of time on the market – an average of 35 days – and Sydney units only spend an average of 33 days on the market.


‘Time on market’ (TOM) is simply the average number of days between when a property is first listed for sale and the contract date.
The rate of vendor discounting is the average percentage difference between the original listing price and the final selling price.
The statistics are calculated across results received by rpdata over the past week and include properties transacted over the past four weeks.
The data is based on private treaty sales only and records without a valid sale price have been excluded from the vendor discount analysis. The analysis also excludes results where there are less than 10 observations.