High volume of Sydney stock available for sale: CoreLogic RP Data's Shana Miller

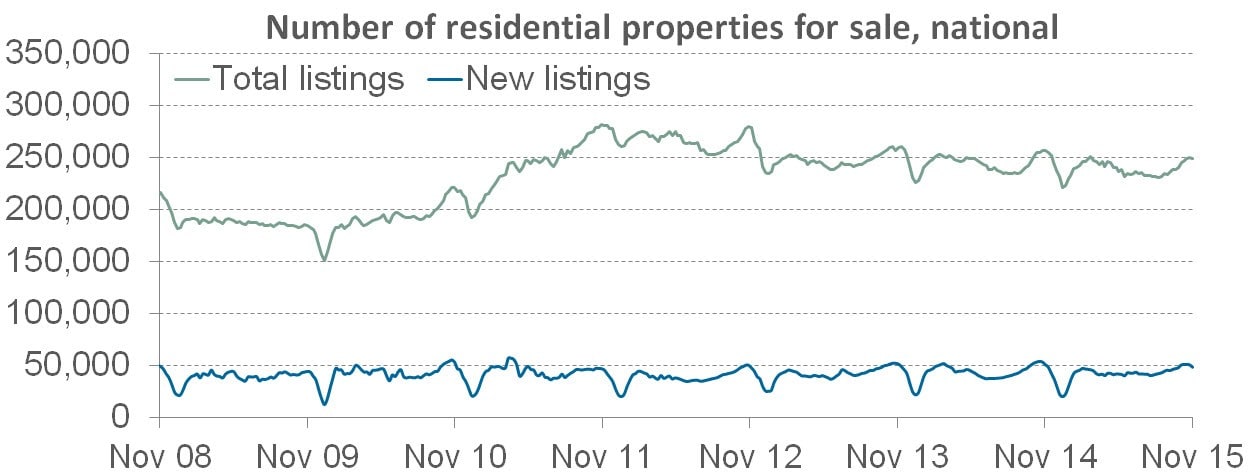
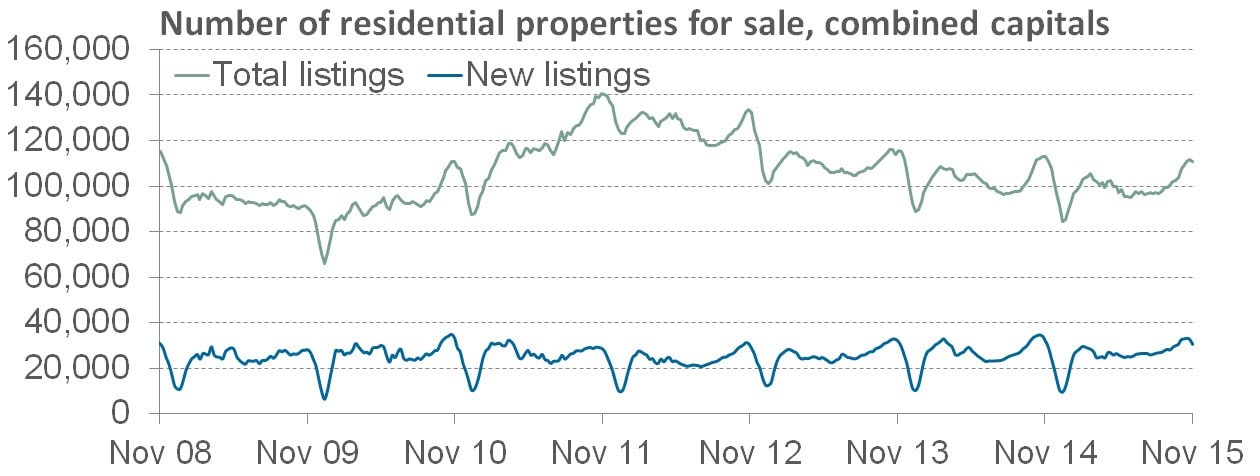
There were a total of 249,133 residential properties available for sale across Australia as at the week ending 29 November 2015, with 110,884 capital city properties available for sale, indicating that total stock levels are -1.7% lower than last year across the combined capital cities and -2.8% lower nationally.
Over the most recent four week period, the majority of listings newly added to the market were within the capital cities, with 30,539 new advertisements, compared to 18,104 in regional towns, which means 63% of new listings were in capital cities, while across the total stock pool, capital city listings account for just 45% of available properties
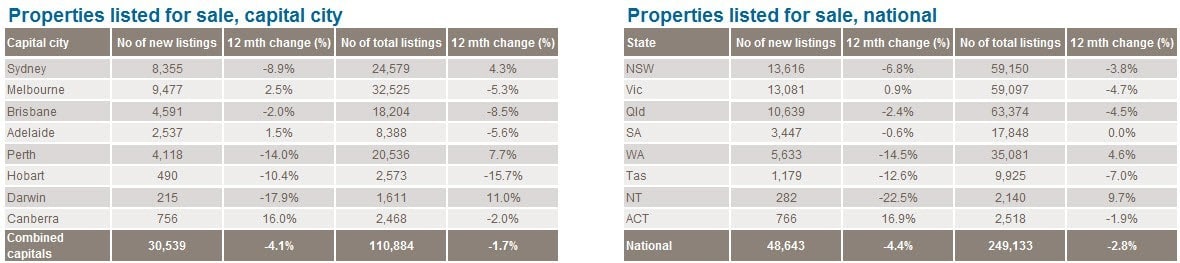
- Melbourne – 9,477, which is 2.5 per cent higher compared to the same period last year (9,246)
- Adelaide – 2,537, which is 1.5 per cent higher compared to the same period last year (2,500)
- Canberra – 756, which is 16 per cent higher compared to the same period last year (652)
While in terms of total stock, levels are higher, relative to last year, in Sydney, Perth and Darwin. While Perth and Darwin’s total stock levels have continuously been recorded at a higher volume compared to the relative period one week ago for the entirety of 2015, this has only been the case since mid-September in Sydney.
At one point this month, the total available stock in Sydney was the greatest it has been since late 2011, and based on the four weeks ending 29 November, there were a total of 24,579 residential Sydney properties available for sale, the highest volume of listings since late 2013, giving buyers plenty of choice across the Sydney market.
To put this further into perspective, three months ago, at the end of August, there were just over 19,000 Sydney properties listed for sale. Stock levels have been increasing due to two things, firstly the increase in new listings being added to the market each week, which has been trending upwards since May this year, likely attributed to the increase in home values across the city and associated vendor confidence, while since March sales volumes across the city have generally been slowing.
Nationally, total listings are -2.8 per cent lower than they were one year ago. Across South Australia, the number of total listings is virtually the same as one year ago, while in the Australian Capital Territory, total listings are just -1.9 per cent lower. Across all the other states and territories, the difference between total stock this year relative to last year is more prominent, with Northern Territory (+9.7 per cent) and Tasmania (-7.0 per cent) showing vast differences.