
Commercial real estate market stabilizing after last quarter with small decline in year-over-year

The commercial real estate market stabilized in Q3’16, declining by a marginal 1.1 percent year-over-year, according to REAL Capital Analytics latest report.
After a slow H1’16, $30.4b of income-producing investments were recorded. Development site sales, a key aspect of the Asia Pacific real estate universe, reached $76.3b in Q3’16.
Investment activity in the quarter was largely driven by a number of portfolio transactions in China and Japan, potentially masking a lack of liquidity in Asia Pacific.
Primary concerns such as interest rates hikes, emerging economy bond markets, and political risks are still challenging investment decisions.
Portfolio deals collectively counted for 43 percent of overall volumes in the region. As a result, the market saw fewer active buyers and deals completed.
China outperformed the rest of the region, recording $10.0b in direct real estate transactions in Q3’16, a 28 percent YOY increase. With now one-fifth of the overall activity in the region, China has overtaken Australia to become the second most active Asia Pacific market.
![]()
Cross-border activity continued to grow and accounted for 33 percent of total volume in Q3’16. This surprise increase is largely caused by a decrease of total purchases by domestic investors, rather than a strong expansion in cross-border capital.
In fact, domestic investment volumes declined by 8 percent YOY to $19.0b. Much of this decline in domestic activity was due to strong Asian outbound capital into global markets such as the U.K., U.S. and continental Europe.
Asia Pacific yields remained largely stable over the quarter. One exception was Australia where property yields compressed by additional 20 bps across all asset classes and geographies, pushing pricing closer to its 2007 peak levels.
Meanwhile in Japan, yield compression slowed down dramatically as commercial property yields reached their peak levels and market activity tapered.
Due to aggressive pricing, foreign buyers are struggling to compete with strong domestic competition and as a consequence became net sellers for the first time this cycle.
The uptick in investment volume in Q3’16 may give the impression of an improving market, following year-over- year declines in the first and second quarters.
However, the economic fundamentals and the ultimate drivers of real estate income have not changed.
Most importantly, when looking at the volumes in greater detail, Q3’16 was driven by a number of portfolio transactions in China and Japan.
In fact, portfolio deals − five of these above $500m – collectively counted for $13.0b, representing 43 percent of overall investment volumes in the region.
As such, the market saw fewer active buyers and deals completed in the quarter. The largest portfolio was CITIC China Overseas $4.7b (RMB31.6t) residential assets sale, which resulted in an increase in apartments sector growth.
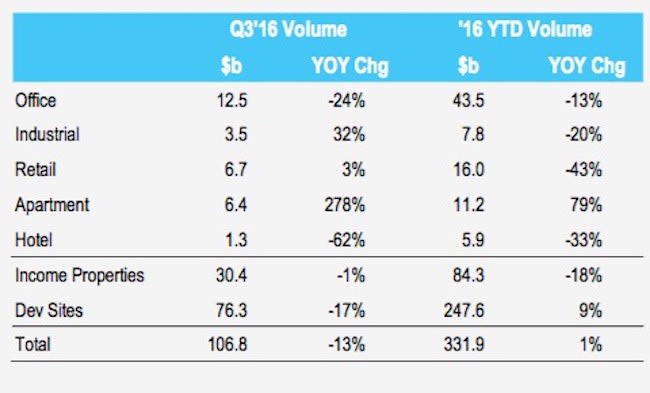
Looking only at single assets, investments have been focused on the office sector, where the majority of core, secured income, long-term stable assets can be found.
The trend of increasing deal size in the office sector continued. (See Q2’16 report.) The average deal size in the office sector grew by another 2 percent QOQ to $80.0m.
The theme of a mismatch between buyer and seller expectations also recurs this quarter. Property yields in most markets remained largely unchanged, Australia being the exception.
Across all Australian cities and asset classes, 12-month average yields declined by 20 bps in Q3’16, reaching their historic 2007 low. In general, the markets for income-producing real estate seem fully priced.
However, as future new investment opportunities narrow, we may see prices shifting even higher.
![]()
As a result of high demand for core real estate, and with pricing at historic peaks, investors are searching for new alternatives.
While some look for more creative strategies in the value-add and opportunistic space, others have found warehouse and logistics assets a feasible alternative.
Investment volumes in the industrial sector reached $3.5b in Q3’16, a 32 percent YOY increase.
Historically, Japan and Australia dominated the space – representing 66 percent of overall transaction activity – but new urban locations for development, particularly in China, have started to appear.
China outperformed the rest of the region, recording $10.0b in direct real estate transactions in Q3’16, representing 28 percent YOY growth. With this strength, China now represents one-fifth of the overall activity in the region, the largest share historically.
China has overtaken Australia in terms of income-producing property volume in Asia Pacific and is now the second most active market. This is partially driven by a number of mega portfolio deals completed this quarter, but the ongoing appetite for Chinese real estate is robust.
Furthermore, development site activity in China recorded yet another quarter of strong activity.
Domestic Chinese developers continued to expand their land banks, collectively investing $226.9b (RMB1.9t) in the first nine months of 2016.
Regardless of an increasing risk of oversupply in some of the Chinese cities, developers remain con dent and land prices are increasing substantially.
According to RCA analysis, the average development site price in China increased by 54 percent YOY in Q3’16.
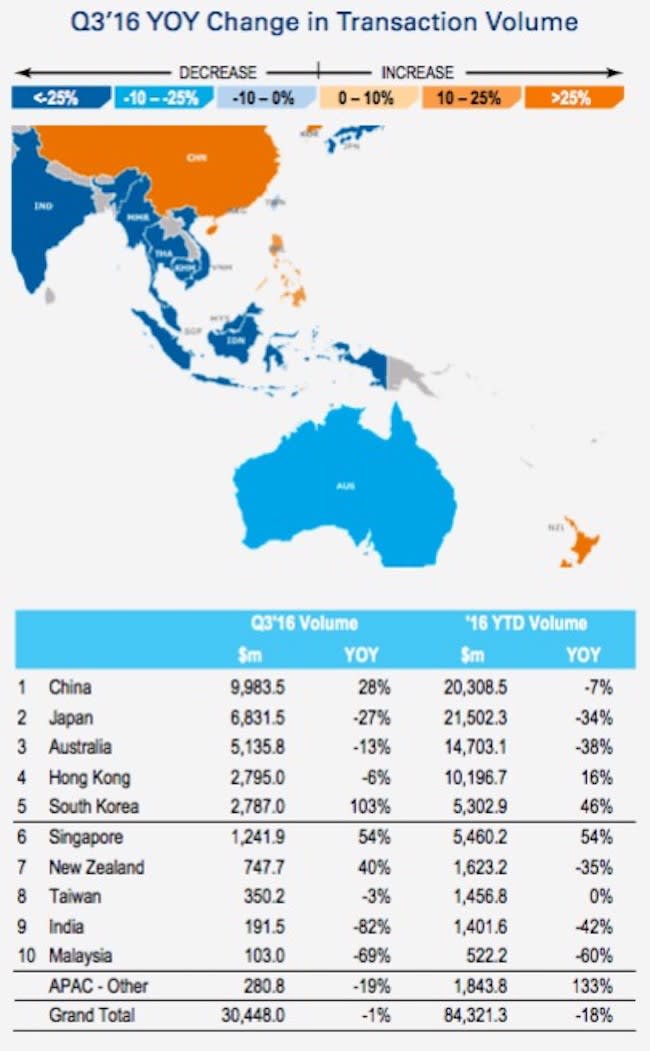
In Hong Kong, activity continued to be boosted by mainland Chinese investors’ purchases, based on confidence fueled by relatively limited new supply and low vacancy rates.
The total volume in Hong Kong reached $2.8b. Hong Kong and China are the only two markets currently with market share above their long-term average share of total Asia Pacific volume.
In contrast, volumes fell by 27 percent YOY in Japan, pushing its market share sharply below its long-term average. Primarily, this is driven by a lack of suitable stock and the reluctance of active buyers to pay current prices.
It should be noted that holding periods on repeatedly sold assets are increasing – a trend common not only to Japan but widespread around the region as investors are increasing reluctant to sell their holdings in the current environment.
Meanwhile in Australia, the market sentiment remains positive, supported by relatively stable investment volumes.
In Q3’16 $5.1b was transacted, placing Australia at its long-term average. There is further upward pressure on property prices, however, and yields have been compressing further across all asset classes and geographies.

