
Clarifying my 40% price drop call and the factors still driving housing prices up
I appreciate Arek Drozda’s very thoughtful piece in yesterday’s Property Observer (“Revisiting Steve Keen’s 40% property price fall prediction”), and this note is intended to clarify some hazy issues.
My 40% claim indeed has become part of the folklore, and as with folklore, the tale is very different to the original event. Arek is quite correct that it was not a prediction, but an analogy to overseas trends, in response to an unscripted question (from memory in a 7.30 Report interview) about what my economic predictions meant for Australian house prices. It was also based on Japan, not the USA, since at the time the USA bubble hadn’t burst. I commented that house prices in Japan had fallen about 40% in the 10-15 years since their bubble economy burst, and I “saw no reason why Australia would avoid the same fate”.
Arek comments that at the time he treated this call “with a fair dose of scepticism since I could not find corroborating evidence for such a substantial fall in prices using indicators from my own analytical toolkit”.
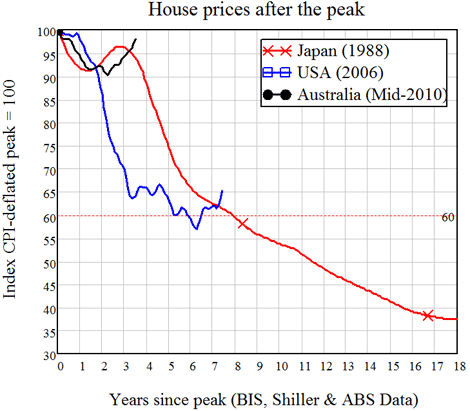
In fact, it appears that I understated Japan’s experience (and by sheer chance picked the level that USA prices would fall by). The Bank of International Settlements — the only formal body to warn of the crisis before it happened— recently released a data series on house prices across the world. Using that data for Japan, Shiller’s data for the USA, and the ABS’s data for Australia gives the picture shown below in Figure 1. Japanese house prices actually fell almost 60% in the 15 years after their peak in 1988, while US prices fell 40% in six years (before the rebound began in 2012).
Figure 1: House prices after financial bubbles burst
However at the time of my answer to a “question without notice”, I hadn’t done any serious analysis of house prices; my focus was on the level and rate of growth of private debt and its implications for the macroeconomy—and on that analysis, in contrast to the vast majority of economists, I believed that a serious crisis was imminent (and that would affect asset prices as well as the real economy).
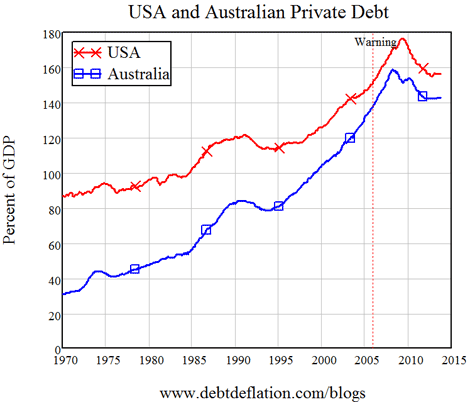
Mainstream economists ignored private debt on the argument that “one person’s debt is another person’s asset” (Paul Krugman 2012, End this Depression NOW!, p. 43), so neither banks nor debt (nor money!) existed in mainstream models. In contrast, private debt played an integral role in my non-orthodox “Minsky model” of the economy. In December 2005, when I saw the trends in private debt in Australia and the USA (see Figure 2 below), I went public with the warning that a serious debt-induced economic crisis was inevitable in the near future:
At some point, the debt to GDP ratio must stabilise–and on past trends, it won’t stop simply at stabilising. When that inevitable reversal of the unsustainable occurs, we will have a recession (see “Debtwatch May 2007: Booming on Borrowed Money”).
Figure 2: Private debt trends and my warnings of a crisis when they reversed
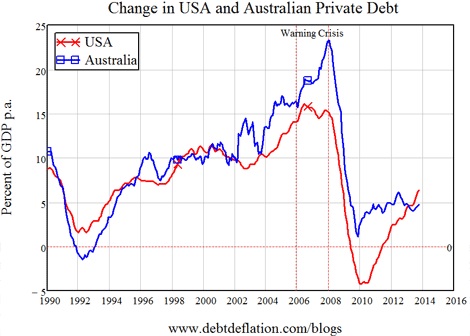
The crisis that I expected duly arrived in 2008, when the rate of growth of private debt began to fall (see Figure 3 below). As Arek points out, my measure of aggregate demand includes the contribution from the change in debt (an argument I’ve since proven here), so my analysis implied that simply a slowdown in the rate of growth of debt can cause a crisis.
Bear in mind that at the same time, mainstream economic advisors like the OECD were telling governments that “the current economic situation is in many ways better than what we have experienced in years”.
Figure 3: The rate of change of debt and the onset of the crisis
Article continues on the next page. Please click below.
Arek also muses about whether the Credit Accelerator was behind my house price call in 2008. It wasn’t, because I hadn’t developed it then—and I didn’t do so until after Biggs, Mayer and Pick developed what they called the “Credit Impulse”, using related but different logic.
The concept itself was an obvious extrapolation from my thinking on aggregate demand: if aggregate demand included the change in debt, then the change in aggregate demand included the acceleration of debt. I simply didn’t develop the idea, because I doubted that economic data would be reliable enough to reveal it, since it would involve comparing a second differential—the rate of change of the rate of change of debt—to first differentials, like the rate of change of house prices.
It turns out that I was wrong: Biggs et al showed that the effect turned up strongly in economic data. I then turned it to asset price data as well—with the approximation that I compared the rate of change of the rate of change of mortgage debt over a year to price change over the year.
As Arek notes, the correlation of the acceleration of mortgage debt with house price change is quite strong: it’s 0.68 in Figure 4, 0.88 since 2010, and 0.63 since 1993 (there was a break in the RBA data in 1991 that stuffs up calculations prior to then).
Figure 4: Stepping on the pedal--mortgage acceleration drives house price changes
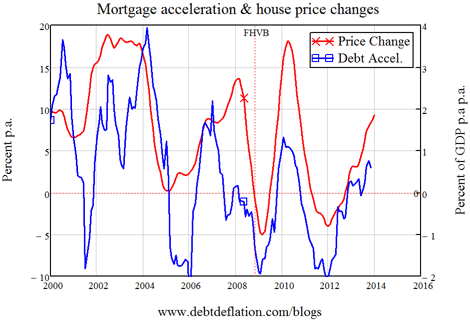
As you can see, the mortgage accelerator indicator was predicting a turning point in house prices from the beginning of 2012. I didn’t make such a call then, partly because I didn’t completely trust my own indicator—which I had only started to develop one year earlier.
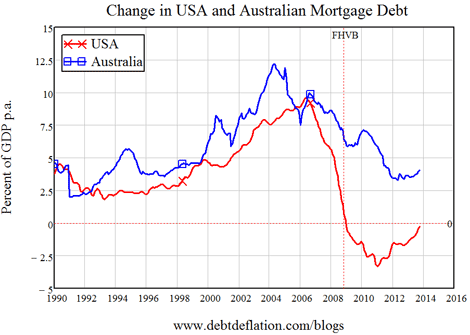
But another substantial reason was, in a word, revulsion. I am first and foremost an economist — and a rebel one at that — and I had hoped the world would learn from this crisis that we can’t base our collective economic welfare on borrowing money to buy second-hand houses from each other. But as Figure 5 and Figure 6 indicate (both below), we’re doing precisely that again: mortgage debt is on the rise once more (and it never fell in Australia, with the First Home Vendors Boost being a major reason that it didn’t do so), and this is driving house prices up again in the USA and Australia.
Figure 5: Mortgage debt on the rise again
I share Martin Wolf’s lament about this. One might hope we would learn from our mistakes, but instead we seem to be in a rush to repeat them:
"The credit machine is indeed beginning to work, once again … But we have seen this play before. It ended as a tragedy… Now, in the UK, people are celebrating the restarting of the very process that ended in this huge disaster."
As for how long the bubble can go on in Australia, we now have two additional factors that are driving prices over and above the impact of accelerating mortgage debt. These are the absence of any controls on non-residential purchases of new properties — as if housing is an export rather than, primarily, a consumption item for Australian residents — and the insane decision in 2007 to let self-managed superannuation funds take levered positions on housing and call it saving for their retirement.
Figure 6: Australian vs US mortgage debt; indebted DownUnder
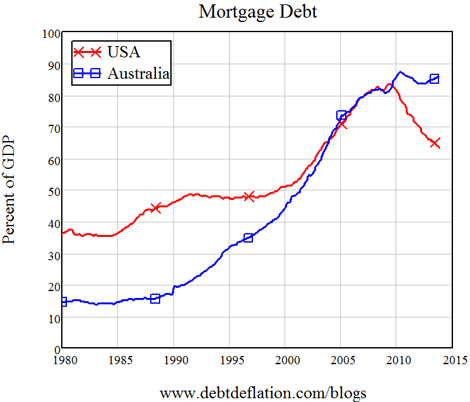
The ride to the top may therefore last longer than the Credit Accelerator might imply (though SMSF mortgages should turn up in the data, much of non-resident buying won’t), and property speculators may well enjoy the ride, as Arek observes.
But to my macroeconomist’s eye, it will be a tragedy for the commons if all we will have to show for this decade is deeper mining holes, more expensive houses, a hollowed-out manufacturing sector, and an even more indebted society.
Steve Keen is the author of 'Debunking Economics', the blog Debtwatch and developer of the Minsky software program.

