
Australian employment gains have been in white collar industries: Justin Smirk

EXPERT OBSERVATION
White collar has driven employment gains but the surge in construction broke a 20yr downtrend for metal manufacturing employment.
- In the year to February 2019, total employment grew 284k or 2.3% which is explained by the expansion of white collar employment and the lion share of this occurred in NSW and Victoria. Of the remaining sectors, the loss of employment in construction and manufacturing sectors was offset by modest gains in leisure & hospitality with some help from smaller gains in retail, education and health.
- White collar employment was boosted by solid gains in public administration & safety (118.2k) and professional, scientific & technical services (93.4k). The gains in leisure & hospitality sectors was split between accommodation & food services (+29.7k) and other household services (+43k).
- Flat employment in education & health hides losses of –36k in NSW and –31.5k in WA which were offset by growth in Victoria (44.5k) and Queensland (30.9k).
- Goods production sector employment declined 41.6k due to a collapse in manufacturing employment (-63.7k) only partly offset by gains in mining (+16.7k) and agriculture (+10.5k).
- Construction had been a significant positive for employment with its share of total employment hitting a record high of 9.6% in 2018 Q1. But through the year it eased to 9.0% with the decline in construction employment making a –0.4ppt drag on annual total employment growth (total ex-construction was +2.7ppt contribution/total 2.3%yr).
- The correction in construction has been focused in NSW and WA with most job losses occurring in construction services. At this stage, building and heavy engineering appear to be peaking, rather than correcting, but these sectors tend to lag the services involved with establishing a construction project.
- Manufacturing dependent on construction expanded employment in 2018, breaking a longer-term down trend. While public infrastructure should support steel demand, at least for the near term, growth is likely to be somewhat less than it has been.
In the year to February, white collar employment explained just about all of the 282k growth in employment. We define white collar employment as those employees in finance, real estate & hiring services, professional, scientific & technical services, other business services and government services.
Click here to enlarge:

Source: Westpac
Household services (accommodation & food services, education & training, health care & social assistance and arts & recreation) has been the powerhouse of employment growth for some time (see chart over) but in the last year there has been a shift of focus with households services employment slowing to 1.7%yr contributing just 0.6ppt to the annual pace of total employment growth.
Meanwhile, business services (information, media and telecommunications, finance & insurance services, rental, hiring & real estate, professional, scientific & technical and administrative support services) employment growth accelerated to 5.2%yr contributing 1.0ppt to annual total employment growth but the big surge came from the 23.5%yr lift in government employment contributing 1.3ppt to the 2.3%yr pace in total employment.
Click here to enlarge:

Source: Westpac
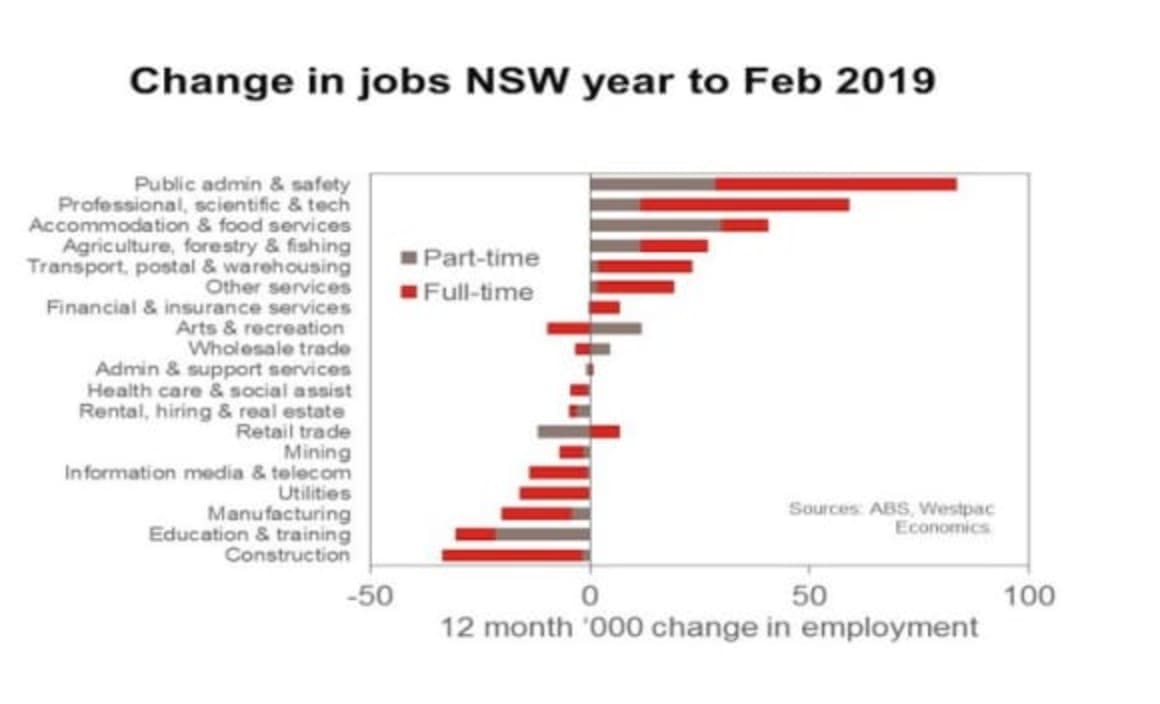
Looking at the state data highlights where the big swings have occurred. In NSW employment gains were driven by leisure & hospitality and white collar while education & health plus construction were the main drags on employment. There was surge in employment from public administration & safety (+83.5k in the year) and professional, scientific & technical services added 58.9k; both of these are white collar and business services sectors.
Accommodation & food services (household services) added a healthy 40.6k but from there it was a drop to +26.7k from agriculture, forestry & fishing (production sector). Leading the decline in NSW employment was –33.5k from construction (production sector) and education & training surprised with a 30.4k decline (household services) and manufacturing shed 19.9k (production sector).
Click here to enlarge:
Source: Westpac
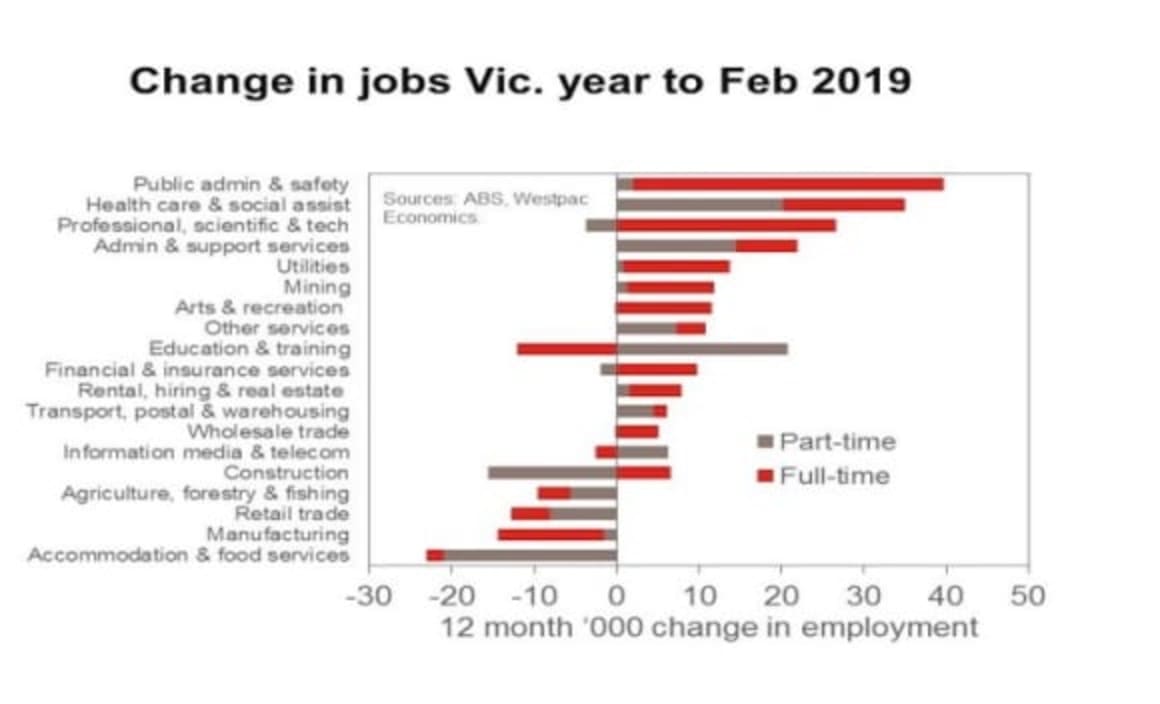
Contrast this with Victoria where education & health plus white collar employment drove the gains. In the year to February total employment grew more in Victoria than NSW (132.7k vs. 120.3k in the year) and at the same time the distribution amongst the sectors was a bit more even. Public administration & safety led the charge in Victoria but the 39.7k gain was somewhat smaller than the gain by this sector in NSW (+83.5k).
Victorian healthcare & social assistance (household sector) added 35k employees where as it contracted –4.2k in NSW, professional, scientific & technical employment lifted 23.1k in Victoria and while public administration surged in NSW it grew a more modest 21.8k in Victoria.
Leading the decline in Victoria was the –23.0k in accommodation & food services employment while manufacturing shed 14.3k employees and retail trade (household sector) was not much better at –12.7k. Victorian construction employment was a bit better than NSW at –9.2k (vs. –33.5k in NSW) full-time construction employment rose 6.4k in Victoria compared to –31.8k in NSW suggesting NSW appears to have entered a more protracted construction downturn as hours worked there appear to be more tightly managed.
Click here to enlarge:
Source: Westpac
For Queensland, just about all of the gains in employment can be put down to household services and, in particular, government employment or sectors funded by governments. Education & training made the largest contribution (+17.6k) but public administration & safety almost matched its contribution (+17.2k) while healthcare & social assistance was not far behind (+14.7k) and information, media & telecommunications made a healthy contribution (12.8k). The key drag in the year was manufacturing (–35.0k), retail trade (–23.3k) and administration & support services (–12.9k). All up white collar employment was positive (+19.5k) adding to the 30.9k gain in education & health and a sound 17.4k contribution from leisure & hospitality more than offsetting the contraction in production employment (–25.7k) and retail & distribution (–26.8k).
WA saw a mix in the sectors driving employment with retail & wholesale gaining 30.8k while white collar employment lifted 29.5k in the year (+16.9k professional, scientific & technology, +15.3 public administration & safety and +9.5k other services more than offsetting the 12.6k loss in arts & recreation and –4.9k in financial services). Mining was also positive (+8.1k) but declines in manufacturing and agriculture (–1.8k and –7.7k respectively) led to a small decline in production manufacturing. In the year to February, education & health swung to being a significant drag in WA shedding 31.5k employees while construction shed 18.2k workers over the same period of time. Manufacturing was basically flat printing +1.8k.
Looking deeper into the sectors sheds some light onto what has been driving employment growth and where the risk to the employment outlook lies.
Click here to enlarge:

Source: Westpac
Construction was an important driver of employment through 2017 with gains peaking at +103.8k /9.8%yr in the year to November 2017. This represented a 0.9ppt contribution to the 3.3%yr pace in total employment growth at that time. Construction's share of total employment peaked a quarter later at 9.5% in February 2018 which was a record high for this series going back to the start of the data in late 1984.
Since then construction employment has fallen 49.2k in the year to February 2019 representing a drag of –0.4ppt on total employment growth (which printed 2.3%yr). The last time construction employment represented a meaningful drag on employment growth was back in 2012 when it contracted –61.6k in the year to August 2012 generating a drag of –0.6ppt on total employment (which printed 1.2%yr).
Given that the starting point of construction's share of total employment is now larger than it was in 2012 (the peak back then was 9.1% in August 2011) construction has the potential to have a larger drag on employment this time should the construction downturn continue to deepen and broaden out of NSW and WA where it is currently focused.
Click here to enlarge:
Source: Westpac
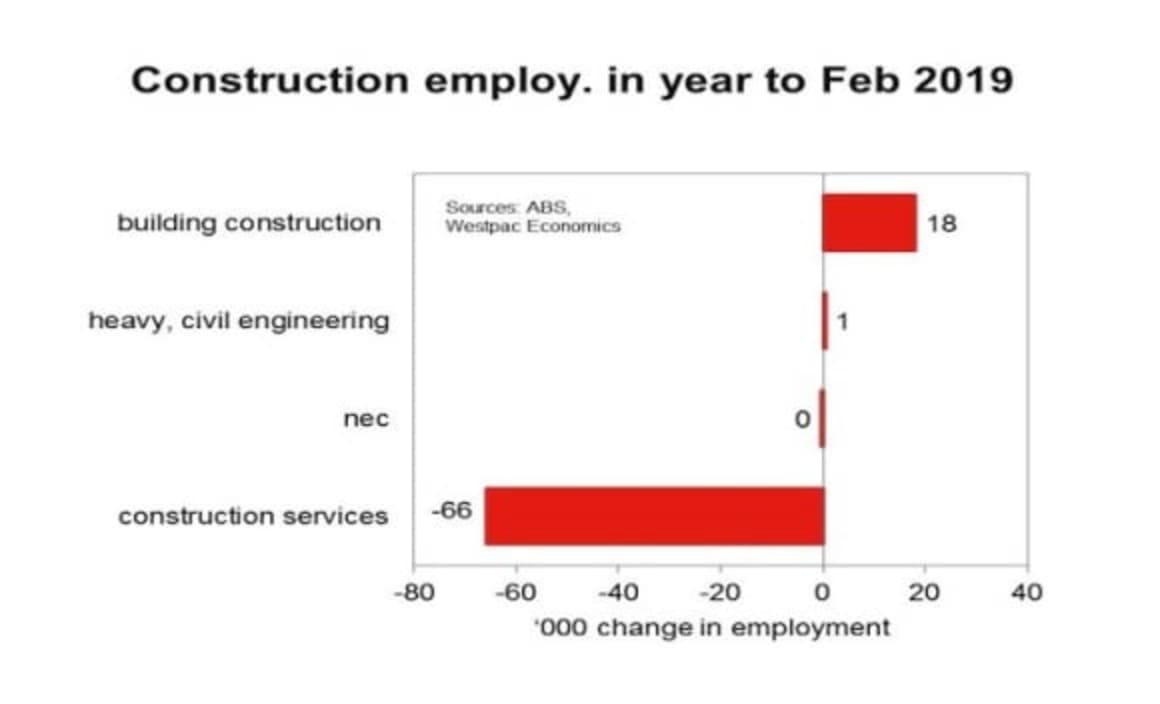
Looking at the breakdown of the sub-sectors behind the correction in construction employment suggests the current correction could have further to run. In the year to February 2019, all of the decline in construction employment can be explained by the –66k decline in construction services. The level of employment in this sector peaked at +777.6k in February 2018 having grown 86.1k, or 12.5%, in the previous two years.
Click here to enlarge:

Source: Westpac
Construction services includes land development & site preparation services, building structure services, building installation services, building completion services and other construction services (which we suspect includes construction contractors). A fair proportion of these services are involved with project and site preparation before construction activity starts. We would expect to see some lift from heavy, civil engineering as public works projects continue but the down turn in dwelling construction activity is going to weigh on building construction employment through 2019 and it is likely to be sometime before construction services find a base to grow from.
Click here to enlarge:
Source: Westpac
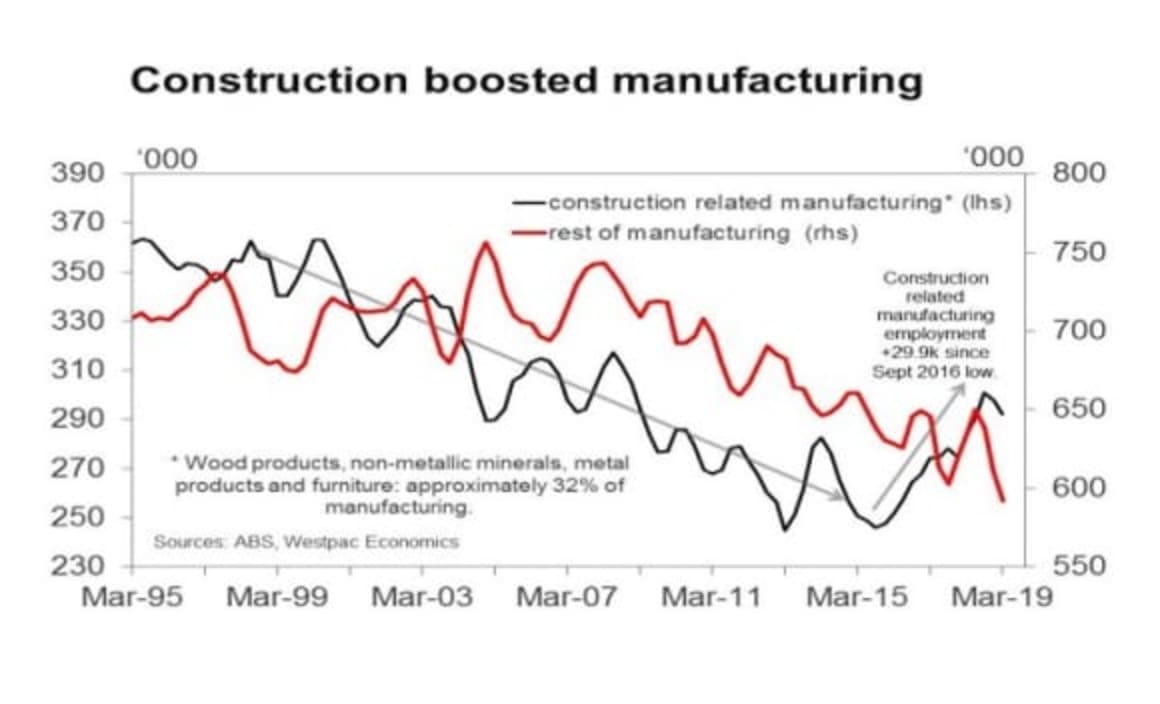
The impact of construction activity on employment is broader than direct construction employment. Westpac has long compiled an aggregate of sectors in manufacturing that would have a strong linkage with construction – wood products, non-metallic minerals, metal products and furniture – which represents a bit more than 30% of manufacturing employment.
Employment in these sectors had been in a trend decline since the late 1990s, as are most manufacturing sectors. During the downtrend there have been some short-run up cycles but from the August 2016 low in employment these sectors grew 29.9k to February 2019, the first sustained uptrend in employment in almost two decades. November 2016 was the recent low in construction employment share of total employment which then rose to a peak in February 2018. Manufacturing employment linked to construction activity peaked in November 2018.
Click here to enlarge:

Source: Westpac
In the last year all of the gains in manufacturing employment has been from metal products (+19.1k); all the other sectors were either flat or declining. Employment metal productions totalled 172.1k in February and if you exclude the recent run-up, employment in metal products is back to a level not seen since early 2014. Not even the mining investment boom produced a comparable lift in steel manufacturing employment indicative of just how significant the recent lift in construction activity has been for broader employment gains. By contrast transport & machinery equipment employment declined 24.9k in the year to February while petroleum, chemical & coal shed 21.0k workers and food, beverage & tobacco has retrenched 16.7k.
Looking forward we don't expect public construction activity to peak until well into 2020 but nevertheless the pace of growth will be somewhat less than it has been. As such steel manufacturing employment should be supported but is very unlikely to be a significant contributor to employment growth going forward and as we head into 2020, it is likely to become a drag on employment.
Looking at the states, Queensland saw the biggest decline in manufacturing employment losing –18.8k employees in the year while NSW shed –7.2k, Vic lost –5.0k and WA lost –2.2k. SA added 9.6k and Tasmania gained 16.6k.
JUSTIN SMIRK is a senior economist for Westpac Group