
Melbourne properties selling the fastest of any capital city: Cameron Kusher

Over recent months the average number of days it takes to sell a residential property has been falling, reflecting the overall improvement in housing market conditions.
The average days on market figure provides valuable insight into the performance of the housing market. The figure measures the average difference between the date at which a property is listed for sale and the day at which it goes under contract. The figure is only calculated across those properties that sold by private treaty, excluding tenders and auction sales. When homes are selling quicker it points to stronger buyer demand and vice versa.
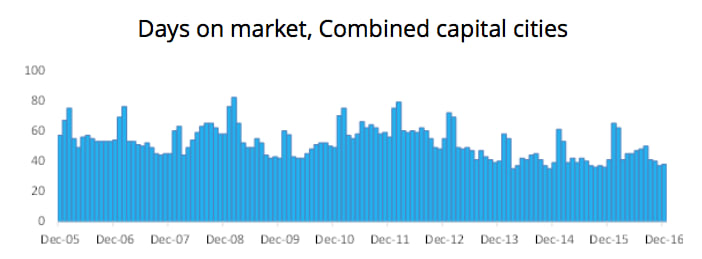
Across the combined capital cities, it took an average of 38 days to sell a home in December 2016. This figure was lower than the 41 days a year earlier and is down from high throughout 2016 of 50 days in August 2016.
Four of the eight capital cities now have an average days on market figure below 40 days while most of the other capital cities are now seeing the days on market figure starting to trend lower.
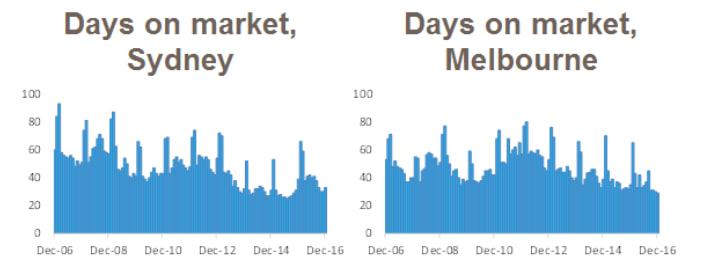
The typical Sydney dwelling sold after an average of 33 days in December 2016 compared to 39 days in December 2015.
Melbourne dwellings took an average of 35 days to sell in December 2015 with the figure falling to an historic low of 29 days at the end of 2016.
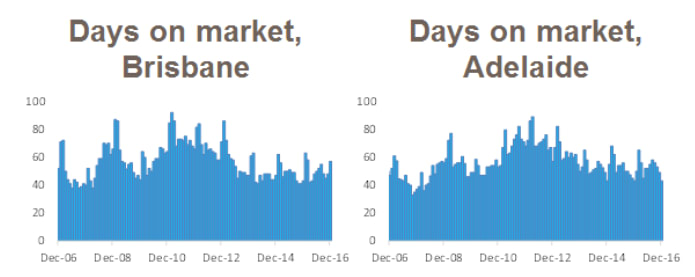
Dwellings were taking an average of 57 days to sell at the end of 2016 in Brisbane compared to 43 days a year earlier. Brisbane is only city in which the days on market figure has trended higher.
Adelaide dwellings were taking 43 days to sell at the end of last year, which is as long as they were taking a year earlier however, the days on market figure has fallen over recent months.
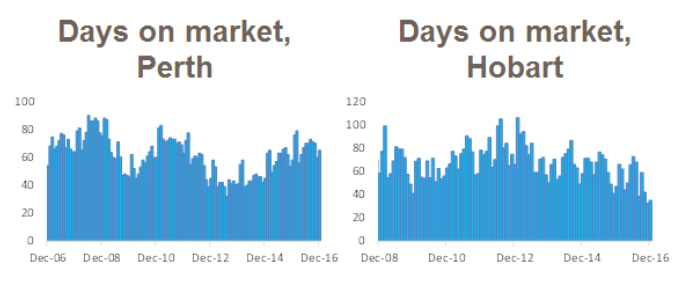
The typical Perth dwelling was taking 65 days to sell at the end of 2016 compared to 58 days at the end of 2015 however, the days on market figure has reduced over the past few months.
Hobart has recorded a large fall in the days on market figure over the past year, reducing from 47 days in December 2015 to 35 days in December 2016.
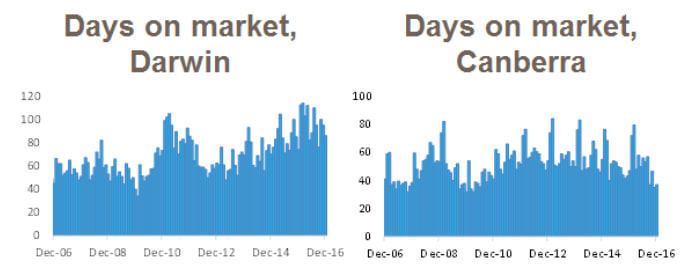
Dwellings in Darwin were taking an average of 86 days to sell at the end of 2016, up from 74 days at the end of 2015 however, over recent months the figure has begun to fall.
At the end of 2015, the typical Canberra dwelling was taking 47 days to sell compared to 37 days at the end of 2016.
The days on market figures will be important to follow throughout 2017. After the current growth phase has run for more than four and a half years, we are still seeing a rapid rate of sale in Sydney and Melbourne. Low levels of stock available for sale and many willing purchases continue to drive a rapid rate of sale in Sydney and Melbourne while the rate of sale is improving in most other capital cities.
The days on market figure will provide a good indication of the strength of individual housing markets throughout 2017. Keep in mind that the next two months of data (January and February) will show the regular seasonal spike but thereafter the data will be much more representative of the housing market’s performance across each capital city.
Cameron Kusher is research analyst for CoreLogic. You can contact him here.

