
Loan-to-Valuation Ratios level out after trending lower since 2013: Tim Lawless

First application Loan-to-Valuation Ratio (LVR) Index from Veda and CoreLogic reveals improved financial security for Australian lenders.
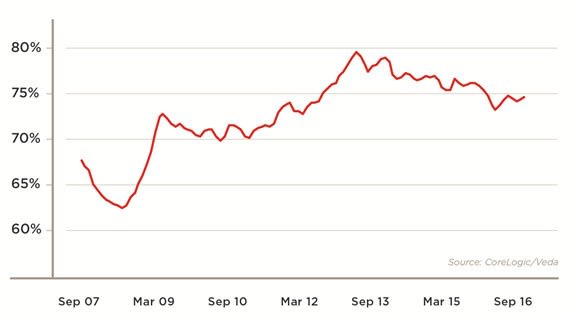
The national average of application loan-to-valuation ratio (LVR) across Australia is currently tracking at 74.3%, according to the new Index from property data and analytics experts CoreLogic, and Veda, Australia and New Zealand’s leading provider of consumer and commercial data and insights and a wholly-owned subsidiary of Equifax.
Application Loan-to-Valuation Ratio National
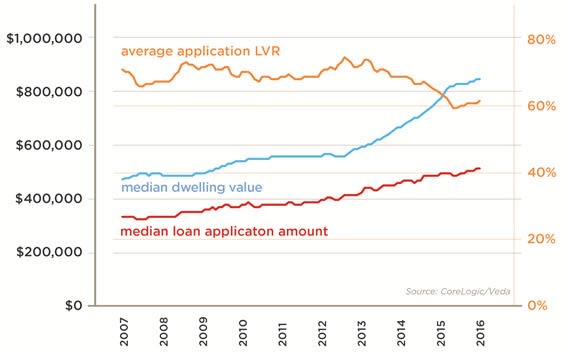
Released tomorrow for the first time, the Index draws on the CoreLogic median dwelling values compared against the median residential loan application amount from Veda. The result is a timely indicator of application loan-to-valuation ratios across Australia over time.
The CoreLogic and Veda measure of application LVRs provides a geographically specific indication on mortgage leverage at a granular level at the time of application.
While the current application LVR is 1.7 percentage points higher than in 2011 (72.6 percent), it is significantly lower than when it peaked in 2013, when the average application LVR was measured at 78.9 percent.
Moses Samaha, Veda’s General Manager of Commercial and Property Solutions, said the new Index would leverage Veda and CoreLogic’s data and insights to provide more detailed analysis of market conditions.
“We are excited to be partnering with CoreLogic to offer more detailed insight into the housing market and level of leverage households are typically committing to,” Mr Samaha said.
“In the past 12 months to September, we have seen the national median dwelling valuation rise 5.5% and the median residential loan enquiry amount rise 3.4%,” Mr Samaha added.
Geographically, the application LVR trend is being driven downwards by higher equity levels and substantial household wealth across the premium housing markets of Australia, particularly in Melbourne and Sydney. However, Sydney has recently experienced an upswing in average application LVRs.
Application Loan-to-Valuation Ratio Sydney Median
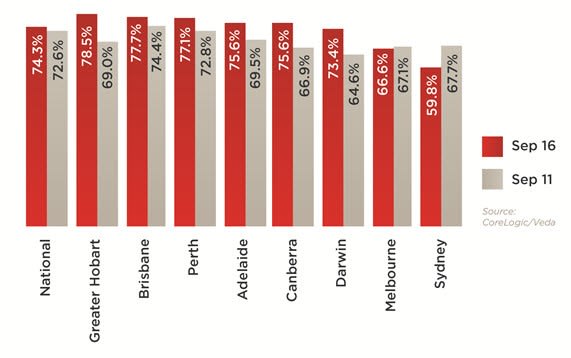
“It’s common for capital cities with weaker housing market conditions to experience an increase in average application LVR. For example, Perth’s application LVR has jumped from 72.8 prcent to 77.1 percent in the past five years, sitting 2.8 percentage points above the national average,” Mr Samaha said.
Application Loan-to-Valuation Ratio Sept 2011 v Sept 2016
“Sydney dwelling values have increased by almost 95% since the beginning of 2009 which has created a large amount of equity for those who have owned a dwelling during this time. High equity is likely one of the key factors that has pushed application LVRs lower in Sydney and to a lesser extent, Melbourne,” Mr Samaha added.
Average application LVRs in the other capital cities show mixed results. Application LVRs in Canberra and Hobart have leveled off recently on the back of improving housing market conditions. Brisbane has also seen the application LVR trend lower, reducing from a peak of 80.5% in October 2013 to the current reading of 77.7 percent.
According to the Veda and CoreLogic findings, the trend towards lower application LVR estimates since 2013 can be attributed to a number of factors.
The increasing volume of refinancing and mortgage top-ups for renovations or home extensions is likely to be a key factor driving application LVR measurements lower.
First home buyers are also likely to be impacting the data. According to Australian Bureau of Statistics housing finance data, the number of first home buyers as a proportion of all owner-occupier housing finance commitments has declined from approximately 17 percent in early 2013 to a recent low of 12.9% in March 2016. First home buyers generally have smaller deposits and their lack of activity in the market may be pushing overall application LVR’s lower.
Tim Lawless, Head of Research at CoreLogic Asia Pacific, said the level of application LVR is an indicator of prudent lending standards and financial stability.
“Regulators and policy makers are likely to see the lower application LVR as a positive outcome, which is reflective of a more considered and prudent lending regime,” Mr Lawless said.
“One of the factors contributing to lower application LVRs is the heightened risk assessment many lenders are applying to select housing markets, whereby larger deposits are required to offset higher lending risk.
“Markets where dwelling values have shown substantial and rapid growth, where supply levels are high, or markets with disproportionate exposure to singular industries, such as mining towns, are typically being assessed by lenders as higher risk. Lenders in these markets are demanding lower LVRs to help minimise their own risk,” Mr Lawless added.
The data from CoreLogic and Veda supports a similar trend in LVR reported by Australian Prudential Regulation Authority, which shows LVRs originating between 60 and 80 percent have comprised a larger proportion of lending.
Tim Lawless is head of the CoreLogic research and analytics team and can be contacted here.

