
Tighter lending policies see a reduction in investor and riskier lending types: Cameron Kusher

The Australian Prudential Regulation Authority (APRA) has released its quarterly Authorised Deposit-taking Institution (ADI) property exposures data for the March 2016 quarter.
This data is really valuable as it provides additional insight into the mortgage market, including data which is not available from the monthly housing finance statistics.
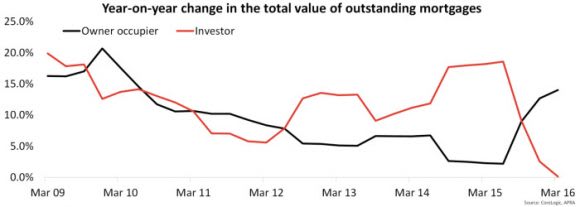
The data initially focuses on outstanding total values and shows that at the end of the March 2016 quarter there was $906.7 billion outstanding to owner occupiers and $501.3 billion to investors. While total lending continued to rise, up 8.7% year-on-year, it is interesting to see how the tilt away from investment lending has progressed.
Over the past 12 months, total investor lending has increased by just 0.1% with the total value of investor mortgage lending outstanding down -3.2% from its June 2015 quarter peak. The data also indicates that investor credit growth now sits significantly below the APRA imposed 10% pa speed limit. This could lead to a rebound in lending to investors over the coming quarters. Total lending to owner occupiers has continued to increase and is up 14.0% year-on-year. In terms of the total value of outstanding mortgages, owner occupiers account for 64.4% compared to 35.6% to investors. The proportion of outstanding mortgages to investors has fallen sharply from its recent peak of 39.0% in June 2015.
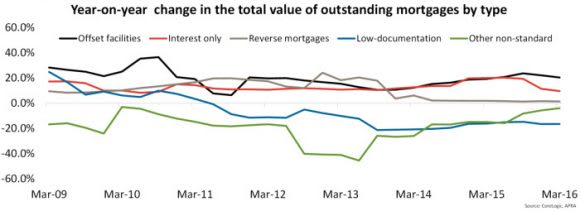
Although the total value of outstanding mortgages is rising you can see that growth is generally slowing. Mortgages with offset facilities account for a record-high 43.0% of all outstanding mortgages and the value of these mortgages has increased 20.4% year-on-year. Interest-only mortgages account for 39.3% of total outstanding mortgages, with the value having increased by 9.6% year-on-year. Reverse mortgages account for just 0.5% of all outstanding mortgages with the value of outstanding mortgages up 1.4% year-on-year. Only 2.4% of the value of outstanding mortgages are for low-documentation loans and 0.1% are other non-standard loans. Year-on-year the value of outstanding low-documentation mortgages is -16.5% lower and other non-standard mortgages are -4.0% lower. In fact the total value of outstanding low-documentation and other non-standard mortgages is at a record low.
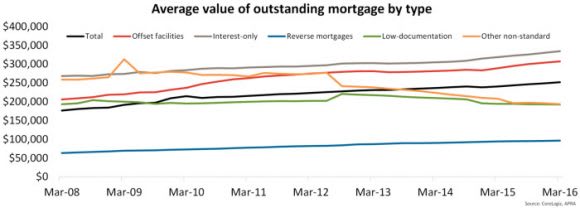
The average outstanding mortgage balance was recorded at $251,900 in March 2016, having increased by 4.8% year-on-year. At the end of March 2016, the average outstanding balances across loan types were: $307,200 for loans with an offset, $334,400 for interest-only, $96,500 for reverse mortgages, $192,200 for low-documentation and $193,400 for other non-standard loans. All loan types except for low-documentation (-1.1%) and other non-standard (-7.0%) have seen the average balance increase over the past year: offset (6.3%), interest-only (5.0%), reverse mortgages (2.4%).
To date, all data analysed has focused on total balances outstanding, the following data will focus specifically on quarterly new lending.
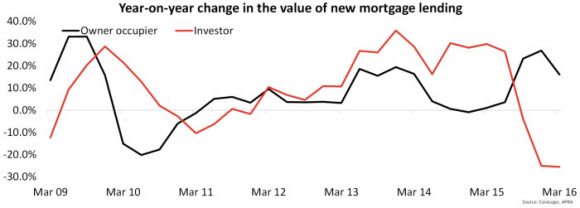
Over the March 2016 quarter there was $81.7 billion in new mortgage lending, which was the lowest quarterly value of new lending since the March 2014 quarter. This figure comprises of $56.0 billion in lending to owner occupiers and $25.7 billion in lending to investors. The value of new lending to owner occupiers has increased by 16.1% year-on-year while the value of investor lending is -25.5% lower year-on-year. The value of new lending to investors is the lowest since the March 2013 quarter and is -37.7% lower from its peak over the June 2015 quarter. The data indicates that there has been a significant pull-back in new lending to investors over recent quarters.
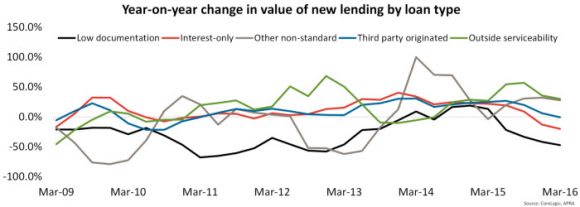
With the value of new mortgage lending falling, the value of most loan types is now also falling. Over the March 2016 quarter, 0.3% of new lending was for low documentation loans, 34.9% was for interest-only, 0.1% was for other non-standard loans, 46.5% was originated through third part channels and 3.8% of loans were approved outside of serviceability. The value of new lending for low documentation mortgages was at a record low. The value of new interest-only lending was the lowest since the March 2013 quarter. The value of other non-standard lending was the lowest since the same quarter last year as was loans approved outside of serviceability. The value of new mortgage lending by third parties was the lowest since the September 2014 quarter.
Higher loan to value ratio (LVR) lending is reducing meaning that borrowers are typically using larger deposits. In fact, the value of new lending for LVRS above 90% in the March 2016 was the lowest since the March 2011 quarter and has fallen by -22.8% over the past year. Lending for LVRs between 80% and 90% has increased by 2.7% year-on-year however, it has fallen over each of the past four quarters. In fact, lending for LVRs above 80% represented 22.4% of all new lending in March 2016 which was its lowest proportion on record and well down from the peak in March 2009 where it accounted for 37.6% of all new lending.
The value of lending to investors is falling sharply as assessment criteria is tightened and investors are typically now charged a higher interest rate than owner occupiers. Interest-only lending which APRA and the Reserve bank have previously sounded warnings about is also starting to fall and is now at its lowest level since March 2013. Higher LVR lending which is associated with smaller deposits are also trending lower which indicates less risky lending. The added benefit surrounding lower LVRs is that if a borrower has a deposit of more than 20% of the value of the property they can typically avoid lenders mortgage insurance (LMI). New lending to loans outside of serviceability, low documentation loans and other non-standard loans has also been falling over recent quarters which is reflective of less risky lending practices being undertaken. These emerging trends can only be positives for the stability and security of the Australian mortgage lending market.
Based on the data presented, it is apparent that tighter lending policies by lenders is having a noticeable impact on the mortgage market.
Cameron Kusher is research analyst for CoreLogic RP Data. You can contact him here.

