
Why spare capacity is driving wages growth, inflation & rates down: CBA's Gareth Aird

GUEST OBSERVER
Advanced economies have essentially been in a low growth, low inflation and low interest rate nexus since 2008. There have been a few oscillations along the way, but the trend has been consistent throughout.
The Australian economy was able to decouple from the “3 lows” for much of that period due to a mining investment boom that left the economy with little spare capacity. As a result, growth, inflation and interest rates were significantly higher in Australia than in the G7 economies. But that has since changed and Australia has transitioned to the low inflation and low interest rate world, says the latest note from CBA Economics.
While GDP growth in Australia has been solid, if not spectacular, domestic demand growth has been soft. And while the unemployment rate has trended down recently, it is still stuck above the level associated with full employment.
In other words, there is slack in the Australian economy and this has led to record low wages growth and underlying inflation now running below the RBA’s 2-3 percent pa target band. The RBA has responded by cutting its policy rate to a record low of 1¾ percent. The latest rate cut can be put down to a change in the RBA’s assessment on the outlook for inflation because the Bank significantly downgraded its inflation forecasts in the May Statement on Monetary Policy (SMP). As a result, we expect further rate cuts to come in 2016 as the central bank seeks to further stimulate the economy. We see the RBA cutting to 1¼%.
This note explores the issues around spare capacity, wages and inflation in Australia and the implications for monetary policy.
Spare capacity and the labour market
Labour market outcomes provide key indicators of spare capacity in an economy. In particular, the unemployment and underemployment rates are measures that show how far an economy is operating below its potential.
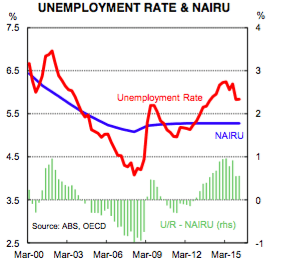
The unemployment rate that is commensurate with an economy producing around its potential output is generally associated with stable inflation. It is referred to as the ‘non-accelerating inflation rate of unemployment’ (NAIRU). The most recent OECD estimates of the NAIRU in Australia put it at 5.3 percent and Treasury estimates it to be 5.0 percent. Whichever way you slice it, the unemployment rate in Australia has been above the NAIRU for the past three years even though it is low by historic standards.
The underemployment rate, however, remains near its highest level on record. This indicates that the Australian economy is operating below its capacity and an output gap has opened up. This has had implications for wages and inflation.
While the output gap in the US has been closing (and core inflation has lifted a little), the reverse has happened in Australia over the past two years. An output gap has opened up primarily due to the end of the labour-intensive mining investment boom and resultant impact on jobs and domestic demand. GDP growth has been solid over that period, but domestic demand growth has been soft.
Decent GDP growth and weak domestic demand growth is reconciled by the strong contribution to growth from net exports. The big lift in resource export volumes is great for headline GDP growth. But mining production is not labour intensive like mining investment. As such, productivity in the resources sector has lifted, but headcount has fallen.
The underemployment rate tends to fly under the radar, but it’s a very usual measure of labour market slack. It provides a gauge of the proportion of people who are employed people but whose labour is not fully utilised. It is near its highest level on record. The sum of the unemployment rate and the underemployment rate produces the underutilisation rate which is the broadest measure of spare capacity in the labour market – it is high and presently sits above the level hit during the Global Financial Crisis.
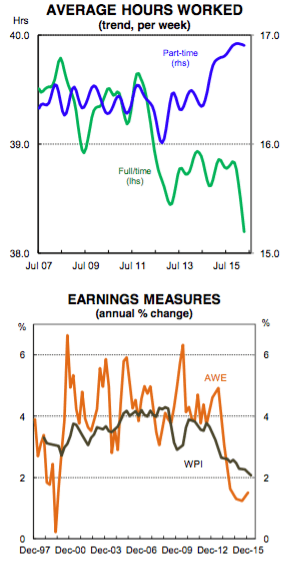
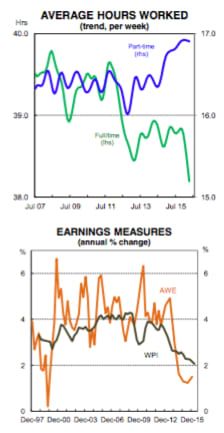
The lift in underutilisation is also captured through the step down in average hours worked by full-time workers from late-2011. Average hours worked of full-time workers remains well down on its late-2011 peak.
Implications for wages
The lift in the unemployment rate and associated increase in spare capacity in the labour market has contributed to a slowdown in wages growth (both real and nominal). Since mid-2010, wages growth has eased and is currently running at its lowest annual rate since the 1990s recession.
The decline in wages growth has been broad-based across the private and public sectors, though the public sector slowdown has not been as pronounced. Most industries have experienced a slowdown in wages growth and the Wage Price Index is growing at a flaccid 2.1 percent pa (as at QI 2016).
The picture appears even softer when looking at Average Weekly Earnings (AWEs) which are running at just 1.5 percent pa. The WPI measures changes in wages across a range of industries (just like the CPI picks up price changes for a basket of goods), but it doesn’t pick up compositional changes in the labour market. AWEs, however, do. Growth in AWEs has declined by more than growth in the WPI because of the shift in jobs away from higher paying mining-related jobs towards lower paid services sector jobs.
The slowdown in wages growth due to a lift in spare capacity and increase in the unemployment rate was expected. But the historical relationship between wages growth and the unemployment rate suggests that wages growth has slowed by a lot more than would have usually been expected. We think that there are a few reasons for this. First, a more flexible labour force enables firms’ greater scope to limit wages growth due to slackness in the labour market. It may be that workers are willing to take lower wages growth for job security.
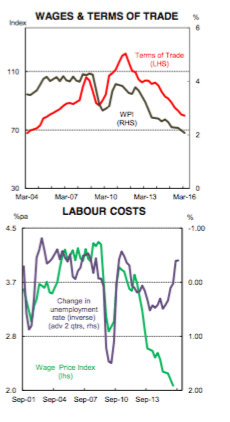
Second, the underutilisation rate has risen by more than the increase in the unemployment rate meaning that the change in the unemployment rate alone is not fully capturing the lift in spare capacity in the labour market. Third, job security fears have risen substantially over the past few years. Employees are less likely to look to negotiate a pay rise while job security fears are elevated. Finally, the terms-of-trade has fallen significantly which means that nominal income growth has supressed across the economy. This has effectively crushed wages growth by more than would have otherwise been the case.
Implications for inflation
Headline inflation has slowed considerably in Australia and has been running below the RBA’s target band for the past six consecutive quarters. Underlying inflation has also slowed and the most recent print (QI) showed it was running at just 1.5 percent pa.
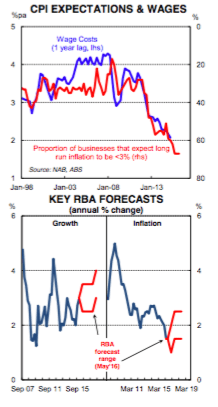
The impact of declining wages growth as a result of a lift in spare capacity has put downward pressure on non-tradables (i.e domestic) inflation. At the same time, tradables inflation has slowed primarily because of a big fall in the price of oil. This muted the impact that the lower AUD was expected to have on tradables inflation. The relationship between non-tradables inflation and wages growth is depicted in the chart opposite. As spare capacity in the labour market has lifted, wages growth has slowed and dragged down the rate of domestic inflation with it.
We expect domestic inflation pressures to remain weak primarily because spare capacity in the labour market will keep a lid on wages costs. Wages growth is unlikely to lift until the unemployment rate gets closer to the NAIRU. And we are some way off that. In fact, falling inflation expectations in Australia points to some further weakness in wages growth.
The NAB survey of businesses suggests that there has been a sharp decline in long run inflation expectations. Almost 70 percent of Australian businesses surveyed expect inflation to average less than 3 percent over the long run, more than double the proportion before 2012. Business long run expectations for inflation has been a good predictor for wage inflation and suggests earnings growth may slow further in 2016 (see chart opposite).
There are other forces, too, that are weighing on inflation. Rental growth, for example, has slowed considerably because dwelling supply has lifted, particularly in the apartment space. With further supply to hit the market over the next 18 months, rent inflation should remain weak. So there aren’t any forces on the near term horizon that point to a lift in inflation. Eventually the large fall in oil prices will ‘wash through’ the quarterly data prints. But even so, we expect the pulse of headline and underlying inflation to remain soft.
Implications for monetary policy
The degree of spare capacity in the economy is an important consideration for monetary policy because it is the primary driver of domestic inflation. The RBA’s rate cut in May came purely down to the Bank’s concerns about entrenched low inflation and disinflation risks. Growth and labour market trends didn’t signal that more rate cuts were forthcoming. Indeed, falling inflation against an unemployment rate that is trending lower is rare.
The Minutes of the May Board Meeting suggest that the decision to cut rates was a finely balanced one. Specifically, “members discussed the merits of adjusting policy at this meeting or awaiting further information before acting”.
So the 50/50 market pricing going into the meeting was probably right. But the May SMP, published a few days after the rate cut, suggests that further policy easing is coming. The Bank made material downgrades to its inflation forecasts in the SMP, shaving ½ppt off its near term underlying and headline inflation forecasts. The RBA now expects both underlying and headline inflation to be 1-2 percent pa over 2016 (below the Bank’s target band). This points to further rate cuts, in our view.
Since the May interest rate cut a number of prominent economists, policymakers and commentators have come out questioning the RBA’s latest rate cut. Indeed, former RBA Governor Ian Macfarlane stated that, “the inflation targeting approach says that if inflation forecasts are below target, we should run an easy monetary policy – we already have that.
It doesn't say that each time we receive an inflation statistic showing it is below target, we have to cut interest rates." And former RBA Governor Bernie Fraser stated that, “I was a bit surprised by the rate cut on budget day because of the ambiguity that such a move is likely to create in the public mind. I wouldn't myself have been concerned about a short period of under 2 per cent inflation – not in the slightest.”
These comments are interesting food for thought. Indeed, we have our own view on whether the RBA should have eased policy in May. But for us market economists, what primarily matters is calling what the RBA is likely to do next and not what we think they should do. As such, we expect further monetary policy easing and have pencilled in two more rate cuts that would take the cash rate to just 1¼ percent. Current market pricing is indicating a terminal cash rate of 1.42 percent.
As always, the timing of picking rate moves is pretty tough. But we favour August and November as these dates follow CPI updates. In our view, all rate meetings over the near term are “live” and activity data will play a role in shaping market expectations and pricing over coming months.
Gareth Aird is economist at Commonwealth Bank and can be contacted here.