
Residential listings trend higher in April: CoreLogic RP Data's Shana Miller

After falling away in March, both new listings and the total volume of homes available for sale across Australia have risen in April.
Over the 28 days ending 1 May 2016, the total number of homes available for sale across the nation rose to 241,633, compared to 235,897 over the 28 day period ending 3 April 2016. However, relative to last year, the total volume of stock listed for sale is -1.7 percent lower, despite the number of newly listed properties being 2.5 percent higher than one year ago.
Of the total stock available for sale, 44.4 percent of properties are located within a capital city, where over the 28 days ending 1 May, 107,199 residential properties were available for sale.
Over the same period, 27,073 new listings were added to the market, accounting for almost 62 percent of new listings added nationally. While the total available stock nationally is lower than it was at the same time last year, capital city listing volumes are 5.1 percent higher (while new listings remain comparable to what was seen one year ago, up just 0.9 percent) suggesting a slower rate of absorption is leading to an increase in stock on market.
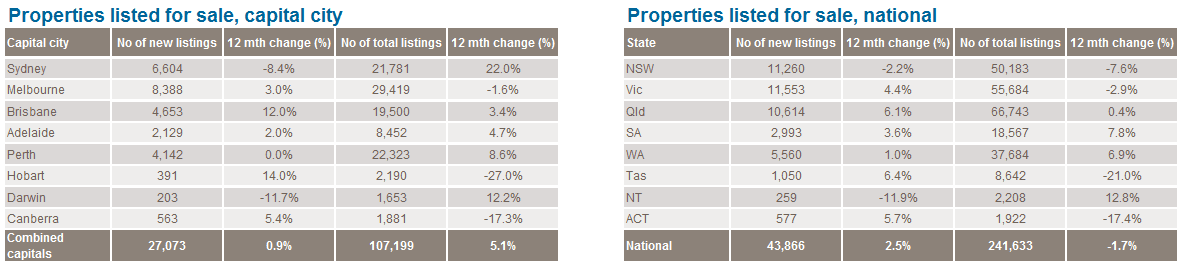
In terms of total stock available for sale, across the individual capital cities, Sydney (+22.0 percent), Brisbane (+3.4 percent), Adelaide (+4.7 percent), Perth (+8.6 percent) and Darwin (+12.2 percent) all have more stock available for sale relative to one year ago, while each of the other cities has less stock available for sale.
While Sydney’s listed stock seems much higher than it was one year ago, if we take a look at the same period in 2014, current listings are just 2.7 percent higher. 2015 was a strong year for the Sydney housing market, with annual home value growth peaking at 18.4 percent in July and strong levels of vendor confidence with market metrics such as low levels of vendor discounting, fast selling times, high auction clearance rates and quick stock absorption further demonstrates the strength across the Sydney property market.
Despite current listings being much higher than they were last year, relative to historic levels across the city, total listings in Sydney remain much lower.
To put this into perspective, current listings across the city are -12.5 percent below what they were in 2010, -22.2 percent lower than 2011, and -34.7 per cent lower than 2012. On the other hand, in Darwin and to a lesser extent, Perth, total listings have been trending upwards for some time now, while new listings remain relatively flat.

When the regional markets in each state and territory are factored in, Queensland (0.4 per cent), South Australia (7.8 per cent), Western Australia (6.9 per cent) and the Northern Territory (12.8 per cent) are all seeing higher stock volumes than one year ago, while New South Wales (-7.6 per cent), Victoria (-2.9 per cent), Tasmania (-21.0 per cent) and the Australian Capital Territory (-17.4 per cent), all have less residential properties available for sale relative to one year ago.


