
Brisbane racks up 14th consecutive quarterly gain: Pete Wargent

Pete WargentDecember 17, 2020
The December 2015 Residential Property Price Indexes figures confirmed the expected slowing in the final quarter of last year, although more timely private sector indices suggest that nationally prices began to rise again in the first quarter of 2016, perhaps by around +1.5 percent. Let's look through the macro trends from the 2015 figures in three concise parts.
Part 1 - Market steadier in summer
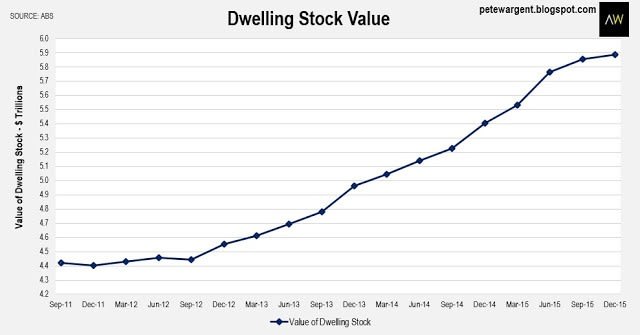
The total value of dwelling stock increased only marginally to $5.9 trillion in the December quarter, rising by $482 billion or +8.9 per cent over the calendar year. This was broadly in line with capital city dwelling price growth of +8.7 per cent, plus a bit more reflecting the value of the new supply of new dwellings.
The total value of dwelling stock has increased by a third or $1.5 trillion since December 2011, now tallying 3.5 times the size of nominal GDP.
Part 1 - Market steadier in summer
The total value of dwelling stock increased only marginally to $5.9 trillion in the December quarter, rising by $482 billion or +8.9 per cent over the calendar year. This was broadly in line with capital city dwelling price growth of +8.7 per cent, plus a bit more reflecting the value of the new supply of new dwellings.
The total value of dwelling stock has increased by a third or $1.5 trillion since December 2011, now tallying 3.5 times the size of nominal GDP.
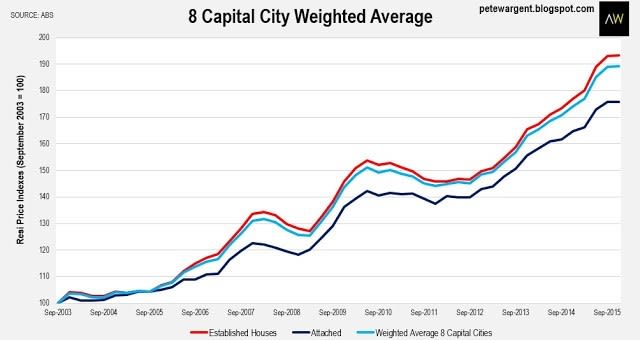
The weighted 8 capital city average indexes showed that both house and unit prices steadied in the last quarter of 2015, with house price growth (+9.3 per cent) outperforming the market attached dwellings (+6.7 per cent) over the course of the calendar year, a triumph for scarcity over affordability.
Part 2 - City by city
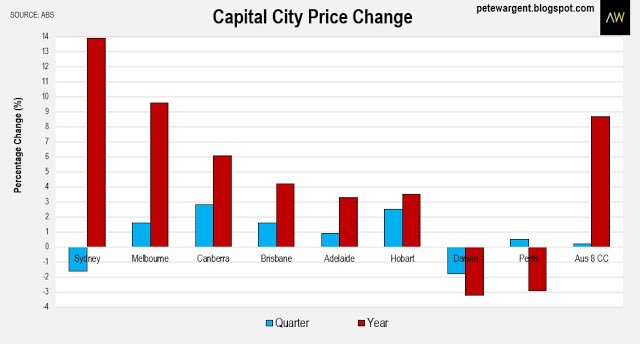
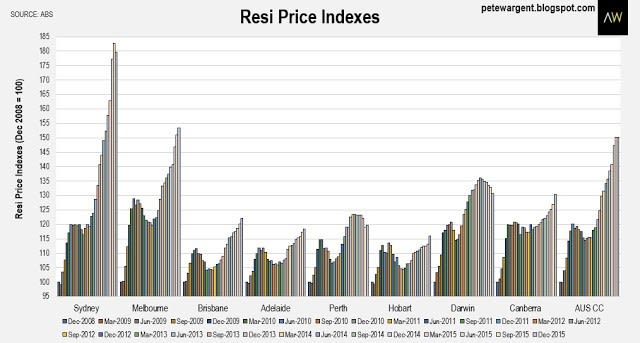
While Sydney showed the expected moderate final quarter correction and Darwin prices tumbled, Perth saw its prices increase by +0.5 per cent leading a number of commentators to call the bottom on Perth's market cycle and to project moderate gains for 2016.
Melbourne prices rose by +1.6 per cent to record strong growth of +9.6 per cent for the year, second only to another immense calendar year for Sydney at +13.9 per cent.
Canberra went on a tear with prices leaping by +2.8 per cent in the December quarter (for +6 per cent growth in 2015). while Hobart prices also spiked by +2.5 per cent for an annual result of +3.5 per cent, mirroring more timely reports from other private sector data providers.
The most steadily consistent performer has been Brisbane, notching up another solid +1.6 per cent increase for its 14th consecutive quarterly gain and a +4.2 per cent annual increase. Since June 2012 dwelling prices have increased steadily by +17.1 per cent in Brisbane. Adelaide has followed a very similar trajectory with somewhat more suppressed nominal price growth.
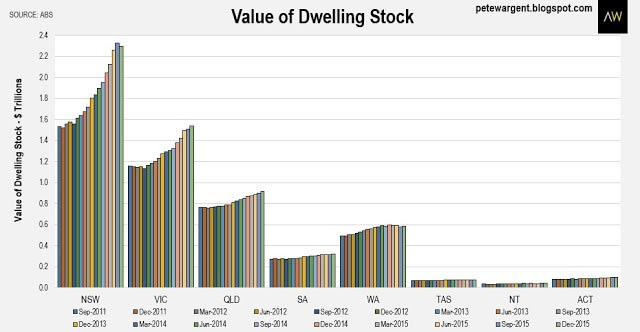
Over the past three years the total value of Australia's dwelling stock has increased by $1.33 trillion, with New South Wales (+$682 billion), Victoria (+$377 billion) and Queensland (+$143 billion) accounting for the bulk of the increase.
Since December 2008 growth in property prices has been driven overwhelmingly by Sydney (+79.8 per cent) and Melbourne (+53.5 per cent), while Brisbane has recorded considerably less price growth (+22.1 per cent) over this timeframe. In fact since that time both Darwin and Canberra have fared better, although the Top End is now in correction mode.
The ABS also now provides some interesting insights into the unstratified median price of established dwelling transfers, which also inferred a slowdown in Sydney house prices (in fact Sydney unit prices rose more than established house prices on this metric, jumping by +11.4 per cent to $685,000).
This data series is most instructive in depicting just how far Sydney and Melbourne house price growth has outpaced that of its respective regional market counterparts.
This data series is most instructive in depicting just how far Sydney and Melbourne house price growth has outpaced that of its respective regional market counterparts.
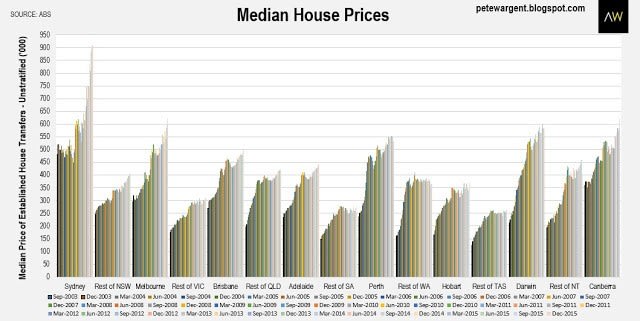
There are myriad ways to look at house price data, some of which involve inflation adjustments and carefully selected data points, while others use hedonic regression analysis, but the simple long run data from March 2002 shows the median transfer price of established houses to be as follows:
- Sydney up from $365,000 to $910,000
- Melbourne up from $241,000 to $621,000
- Brisbane up from $185,000 to $499,800
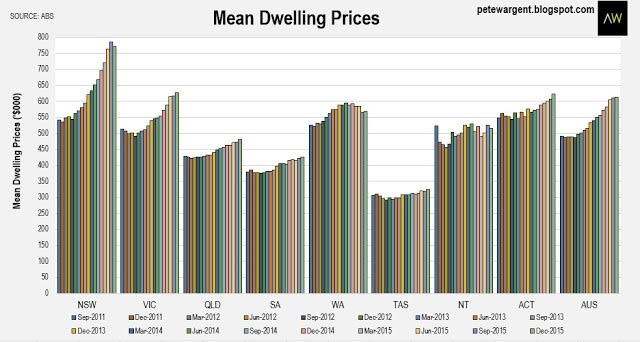
At the state level the mean dwelling prices tell a broadly similar story to the capital city narrative for the past year, with New South Wales (+$76,300) and Victoria (+$56,100) once again recording the greatest gains in calendar year 2015, while the ACT (+$35,000) and Queensland (+$17,600) also saw notable increases.
Part 3 - Supply response mixed
Finally, the data denoting the total number of dwellings at the state level shows how New South Wales added just +7,400 dwellings to its total stock in the December quarter. Nationally the total number of dwellings increased solidly by +162,900 or +1.7 per cent in 2015 to 9.62 million, having now increased by +578,600 or +6.4 per cent since December 2011.
Over the past four years, while the less densely populated territories of the Northern Territory (+10.2 per cent) and the ACT have added substantially to their stock of dwellings in percentage terms, the same has not been true everywhere.
Of the most populous states Western Australia (+8.9 per cent) and Victoria (+7.8 per cent) have co-ordinated the most material supply response as a percentage of established dwellings. However, the percentage increases in Queensland (+6.8 per cent) and in particular New South Wales (+4.6 per cent) have been less marked, reflected in their respective shallower gradients in the below chart.
Of the most populous states Western Australia (+8.9 per cent) and Victoria (+7.8 per cent) have co-ordinated the most material supply response as a percentage of established dwellings. However, the percentage increases in Queensland (+6.8 per cent) and in particular New South Wales (+4.6 per cent) have been less marked, reflected in their respective shallower gradients in the below chart.
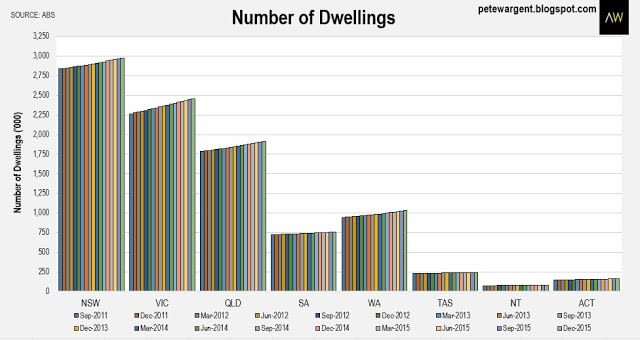
This seems likely to in part to reflect stock obsolescence and demolition in the larger capital cities, where older dwellings are often pulled down in order to make way for new apartment developments. However, in some locations there does remain an elevated volume of apartment construction in the pipeline, which you can doubtless see for yourself if you frequent the inner city hubs.
The wrap
Overall this historical data reflected already known market trends with the restraints on investor lending propitious in tapering price growth towards the end of the calendar year. At the macro level we can expect price growth nationally in 2016 to be lower than the +8.7 per cent seen in 2015, with investor lending have been successfully curbed and more supply due to come online.
House price growth has resumed in 2016 in parts of Brisbane and Melbourne, Sydney's market has become a bona fide dichotomy, with many of the inner ring suburbs firing, but the outer ring now recording funereal auction results. Naturally at the sub-regional level results are far more mixed and trends more nuanced.
PETE WARGENT is the co-founder of AllenWargent property buyers (London, Sydney) and a best-selling author and blogger.
His latest book is Four Green Houses and a Red Hotel.
Pete Wargent
Pete Wargent is the co-founder of BuyersBuyers.com.au, offering affordable homebuying assistance to all Australians, and a best-selling author and blogger.