
The seven signs that the property market may be peaking: Tim Lawless

There are mounting signs that Australia’s housing market may be moving through the peak of the cycle, however it is important to remember that strong housing market conditions have been evident in Sydney and Melbourne while every other capital city has shown relatively sedate conditions.
CoreLogic’s September indices results, released two weeks ago, showed that Sydney dwellings values remained flat over the month and other data flows are also pointing to a moderation in growth conditions across Australia’s largest city and the broader housing market.
The factors that hinting at a market peak (and outlined in further detail below) include:
- Auction results have been consistently moderating, especially in Sydney where clearance rates have been sub 70% consistently over the past five weeks
- Listing numbers are rising, which is normal during the Spring season, but a higher than normal number of homes are being added to the market in Sydney which is contributing to higher stock levels than a year ago and rising months of supply.
- Investment demand is moderating due to both tougher lending from the banks as well as market disincentives such as low yields, affordability constraints and a mature growth cycle.
- Mortgage related activity has fallen across CoreLogic platforms. Although activity remains higher than a year ago, mortgage related events are down from heights seen over the first half of 2015 and aren’t seeing their normal spring bounce.
- Rents are hardly moving which has pushed rental yields to historic lows in Sydney and Melbourne. Paying a landlord is likely becoming more affordable than paying a mortgage despite the low interest rate setting.
- The cost of debt is rising outside of any upwards movement in the cash rate. Higher debt servicing costs can only act as a disincentive.
- Supply levels are set to rise further as the pipeline of approvals moves through the commencement phase and onto completed housing product. Inner city apartment markets are most exposed to higher supply.
While conditions may be starting to slowdown, particularly in Sydney, the coming months will provide further clarity about housing market conditions. Picking the turning point in the housing market is easy in retrospect, but as the market evolves it can be hard to separate short term movements from the beginnings of a longer term trend. The coming months of data flows through to the end of the year will provide a great deal more perspective.”
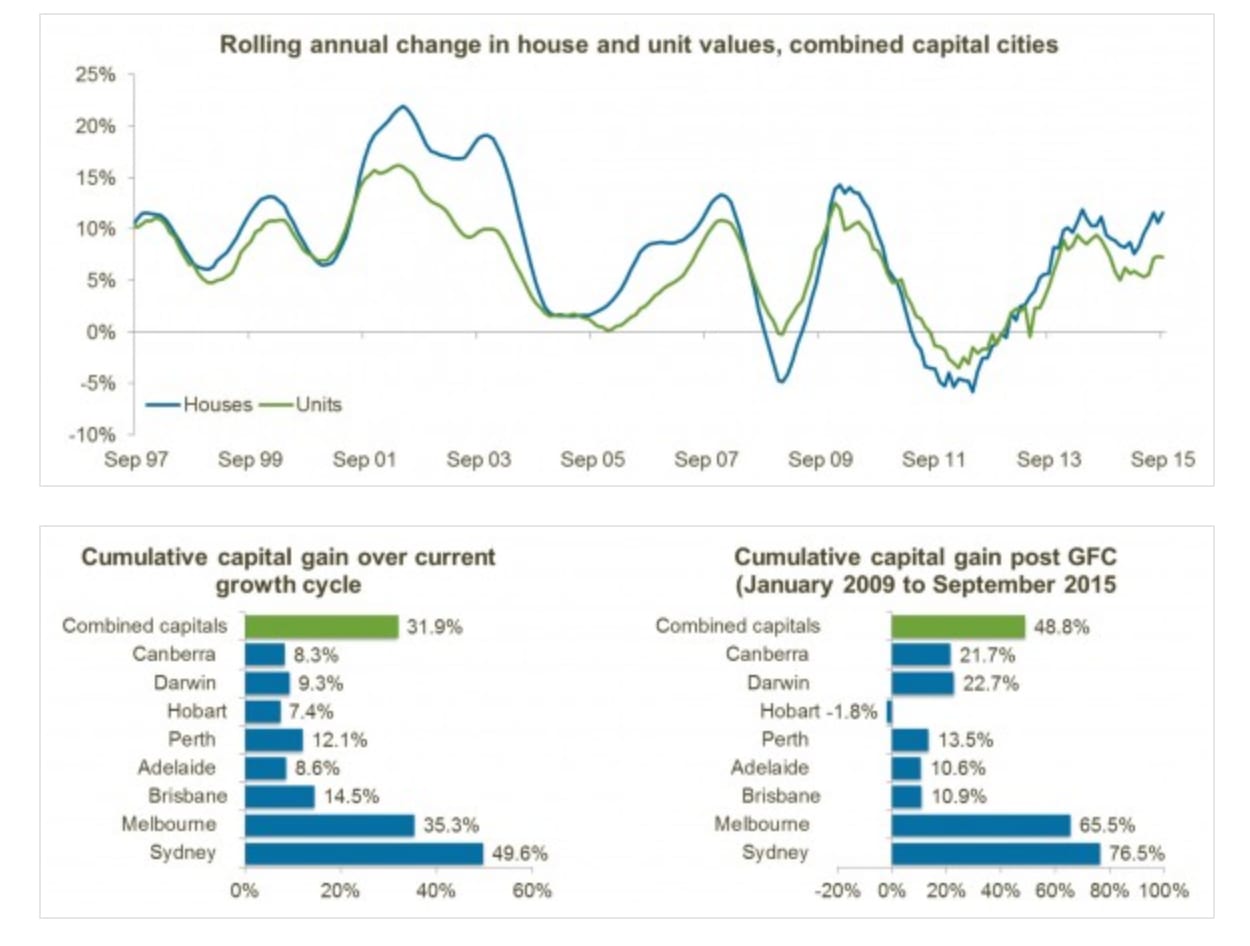
Mature growth cycle
The current growth cycle broadly commenced in June 2012, with dwelling values shifting almost 32% higher since this time across the combined capital cities. The rate of capital gains has been led by Sydney where values are almost 50% higher, and Melbourne where dwelling values have shifted 35% higher over the cycle to date. Brisbane has seen the third highest rate of value growth over the period at a comparatively modest 14.5% showing the multi-tiered nature of the capital city housing market at present.
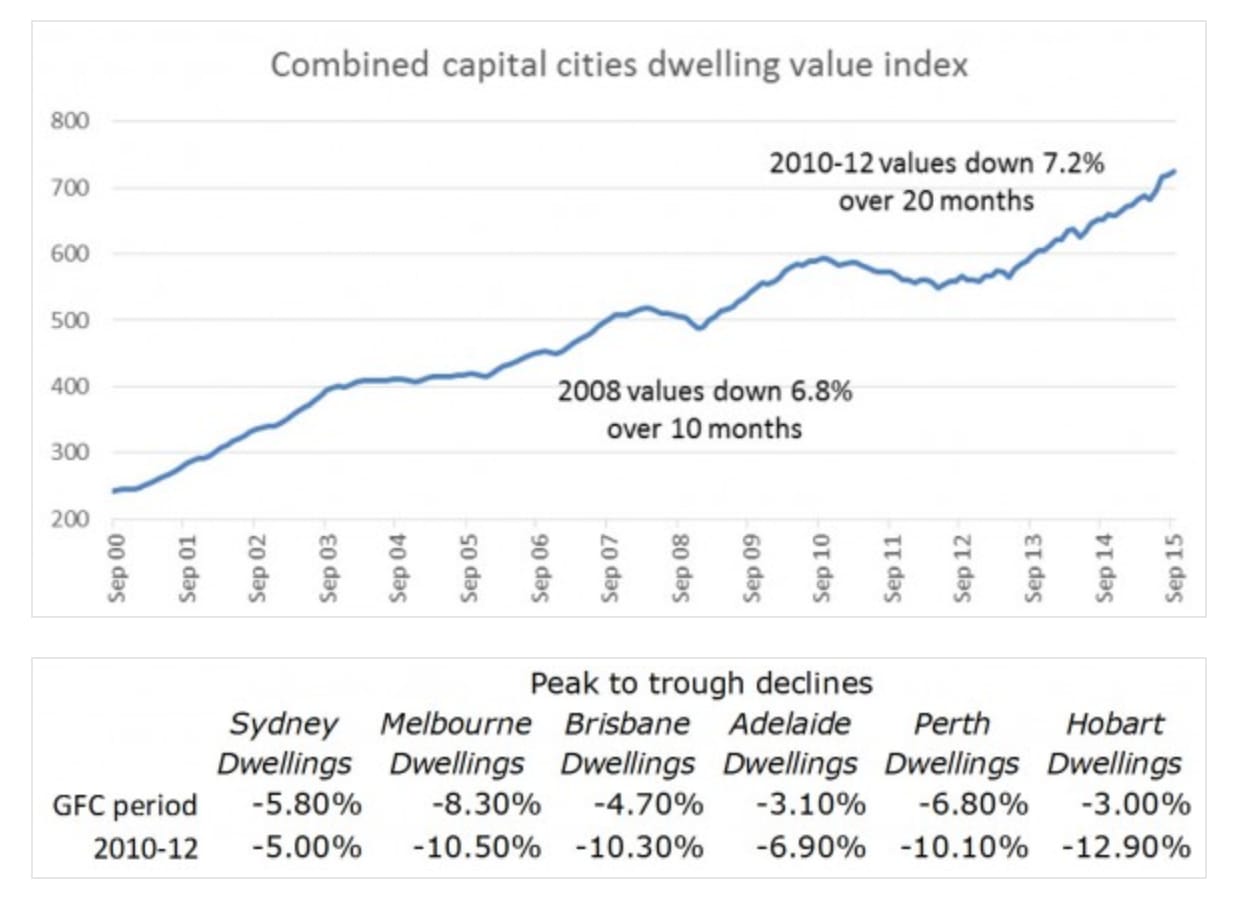
Dwelling values do fall.
Capital city dwelling values retreated by 7.2% over the previous down phase which lasted from October 2010 through to the end of May 2012, and previously during the GFC period of 2008 capital city dwelling values shifted 6.1% lower.
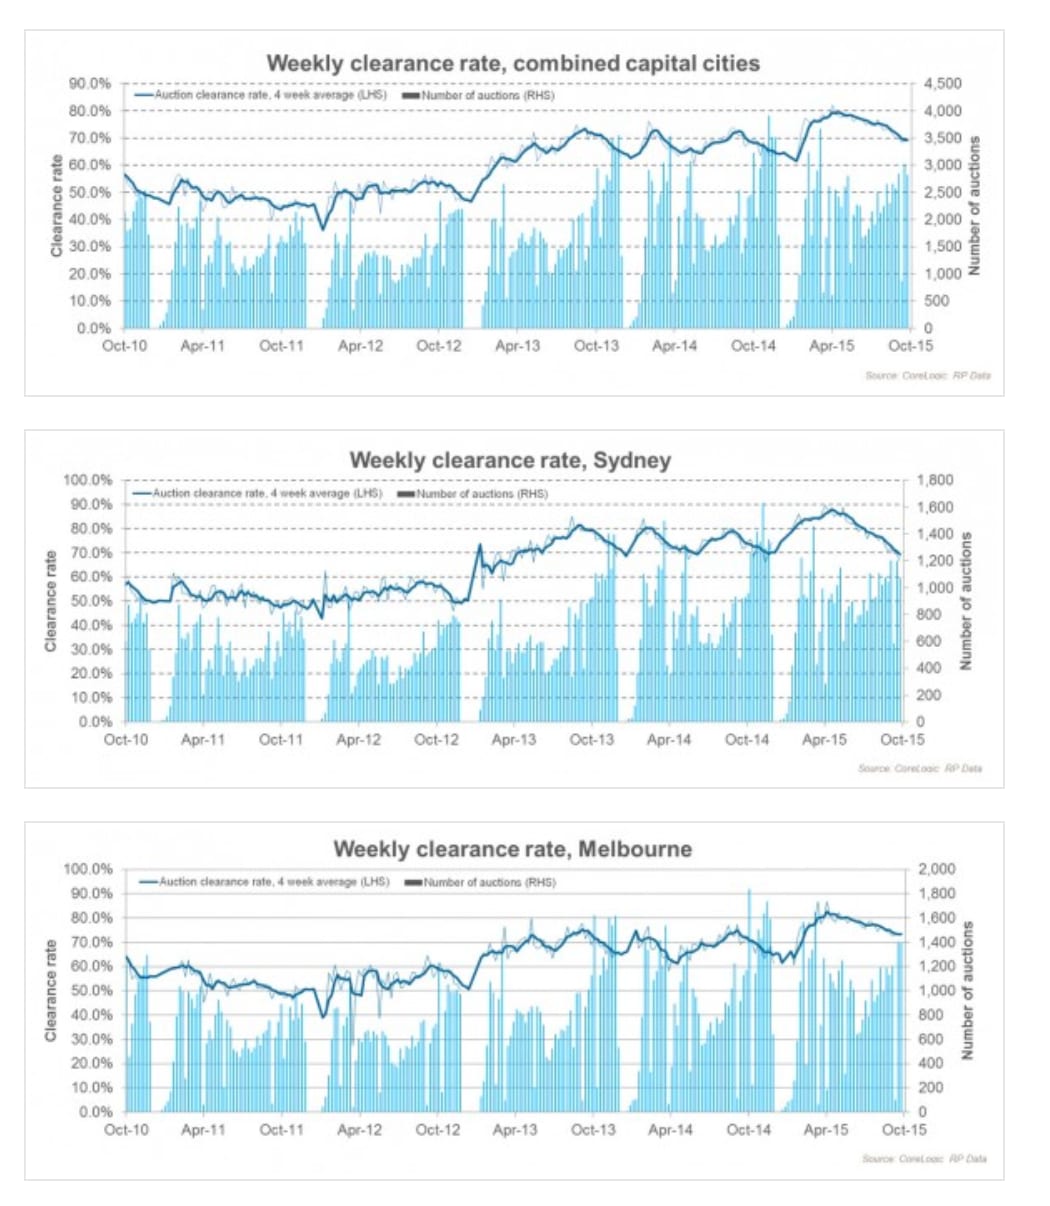
Auction results are moderating but remain historically high
The auction market peaked over the last week of April this year with a combined capital city clearance rate of 82%. Since that time, clearance rates have been consistently falling, with weekly clearance rates holding below the 70% mark over the past five weeks.
Sydney has shown a similar trend, with clearance rates peaking at 90% over the last week of April. Sydney’s clearance rate was recorded at 63% last week, the lowest clearance since March 2013. The lower clearance rate comes on substantially higher volumes compared with a year ago. The Spring season to date has seen 7,193 auctions held across Sydney which is 1,609 (29%) higher than over the same period a year ago.
The slump in clearance rates hasn’t been as sharp in Melbourne where the weekly clearance peaked at 87% over the last week of April and has consistently reduced to the current level of around 73%. Melbourne clearance rates haven’t slipped below 70% since February this year. Auction volumes across Melbourne are at roughly the same level as a year ago, with 7,394 auctions held so far this Spring (7,381 at the same period a year ago).
Outside of Sydney and Melbourne, auction sales are only a small proportion of all sales. Over the year to date, Sydney and Melbourne account for 84% of all auctions held across the capital cities.
Listing numbers are rising
While it’s normal for listing numbers to ramp up during the Spring season, the number of new listings being added to the Sydney housing market is now 4.4% higher than last year and total listing are nearly 6% higher than a year ago suggesting new advertised supply isn’t being absorbed as fast as a year ago. The same trend of higher listing numbers has been evident for some time in the weakest housing markets of Darwin and Perth where total listing are roughly 12% higher compared with a year ago.

Listing numbers haven’t seen the same escalation in Melbourne where the housing market doesn’t appear to be slowing at the same pace as the Sydney market. Listing numbers remain lower than a year ago in Brisbane, Adelaide and Hobart as well, where value growth has been much more moderate compared with Sydney and Melbourne.
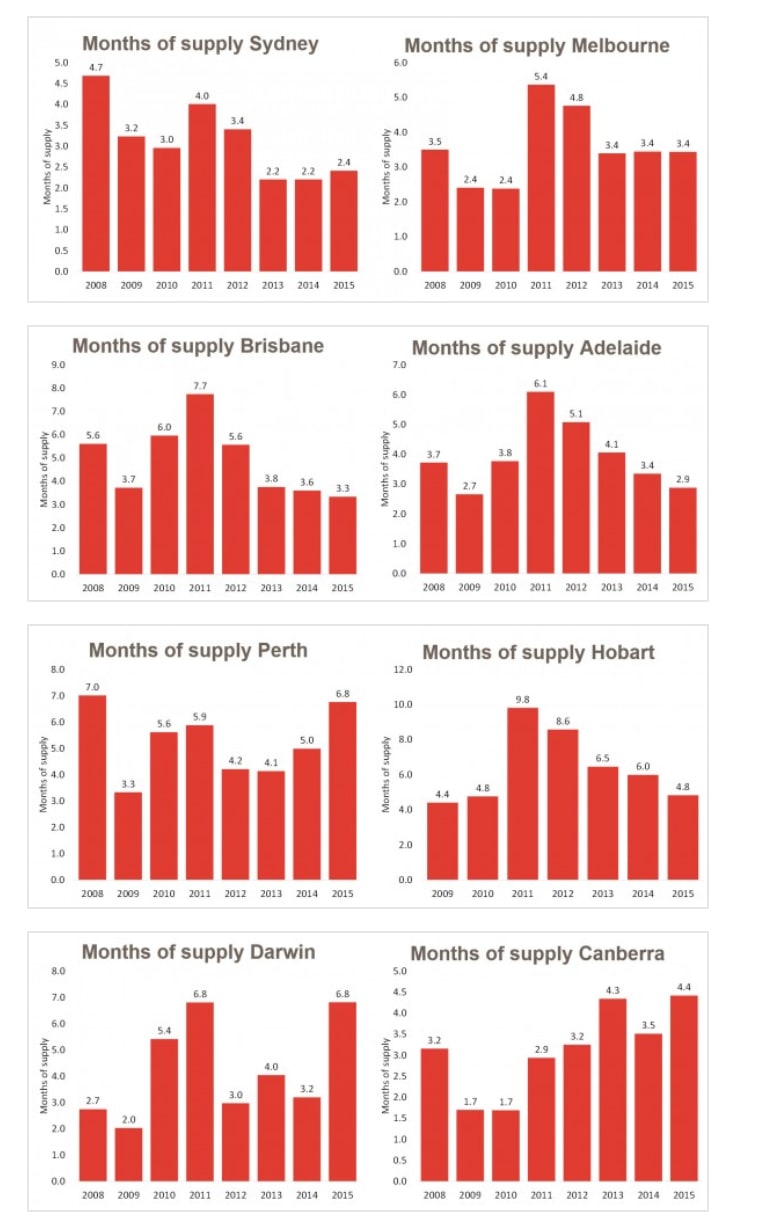
With listing numbers rising in some markets, ‘months of supply’ is also rising
‘Months of supply’ provides an indication about how long it would take, based on the current rate of sale, the market to absorb all the homes currently being advertised for sale. Sydney is still showing the months of supply reading at 2.4 months, however, we have seen the first rise in this reading since 2012.
At the same time, months of supply is holding firm in Melbourne but reducing in Brisbane, Adelaide and Hobart. Where housing market conditions are weaker (Perth, Darwin, Canberra) the monthly of supply readings are rising, providing better buying conditions for prospective purchasers.
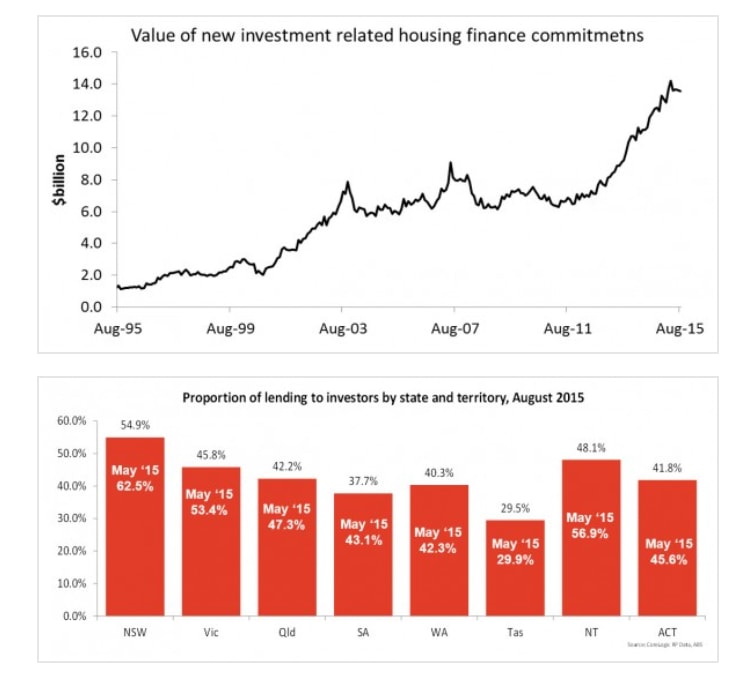
Investment demand appears to be moderating
The value of investment related housing finance commitments has reduced over three of the past four months and owner occupiers have once again overtaken investors as being the most active segment of the housing market based on the value of new loans being committed to.
The slowdown in investment related mortgage activity has been evident across every state, but has been most felt in New South Wales, where investors have reduced from comprising nearly 63% of the market in May this year to a much lower (but still high from a historical perspective) 54.9% in August. It’s likely investment activity has reduced further over recent months due to the premium being placed on investment mortgage rates and a requirement for larger deposits, as well as natural disincentives such as record low rental yields and affordability and affordability constraints.
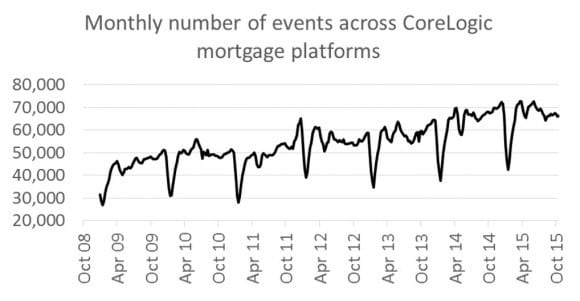
Mortgage related activity has eased from historically high levels across CoreLogic mortgage platforms
CoreLogic facilitates more than 90% of all mortgage related valuation instructions, which provides one of the timeliest indicators of mortgage activity available. While mortgage activity is approximately 4% higher than at the same time last year, activity has moderated from the highs recorded earlier in the year.
Weekly rents are hardly moving and gross rental yields have pushed to record lows
Across the combined capital cities, weekly rents have increased by only half a percent over the past twelve months. At a time when capital city dwelling values have increased by 11.0%, the sluggish pace of rental movements has pushed rental yields to the lowest level on record.
Gross rental yields are the lowest in Melbourne and Sydney at just 3.0% and 3.3% respectively (lower for detached houses and slightly higher for apartments) and also sit at record low levels. Accounting for holding costs such as vacancy, property management fees, maintenance etc, the net rental yield in these cities likely to be around the low to mid two percent mark.
The low yield scenario is likely to act as another disincentive for investors at a time when the growth cycle has been running for almost three and half years.
for investors at a time when the growth cycle has been running for almost three and half years.

Costs of debt are rising out of cycle with the cash rate
In July this year Australia’s largest banks placed a premium on investment related mortgage rates of between 27 and 29 basis points. More recently, Westpac has announced additional premiums on mortgage rates for both owner occupier and investment loans outside of any movement in the cash rate.

Supply levels are set to increase further
Dwelling approvals appear to have peaked earlier this year after an unprecedented boom in the number of dwellings approved for construction. As the pipeline of approvals migrates to project commencements and ultimately completions, we can expect the supply of new housing, particularly apartments, to provide a further easing in price upwards price pressures.
The majority of new supply set to hit the market will be in Melbourne and Sydney where population growth has remained the strongest, however Brisbane and Perth have also seen a substantial influx of new housing approvals. In last week’s Financial Stability Review the Reserve Bank warned of the risk of a potential housing over-supply in inner city areas of Melbourne and Brisbane due to the large boom in new apartment construction.

Tim Lawless is head of the CoreLogic RP Data research and analytics team and can be contacted here.

