
Liverpool took off, but Subiaco was a dud: winners and losers in NAB's 27 survey predictions for 2014

In February last year, NAB released a list of suburbs tipped to enjoy above average capital growth over the next year.
The list was compiled from responses from a panel of respondents involved in the real estate industry, including agents, developers, fund managers and investors.
This year, 28 outperforming picks have been chosen including Sydney's Penrith, Melbourne's Essendon and Perth's Kelmscott.
But how did last year's picks fare?
Property Observer has cast an eye over the 27 suburbs picked out by NAB's respondents at the beginning of 2014, excluding the city centres – Darwin, Brisbane, Melbourne, Sydney and Perth – due to lack of specificity.
The suburb where NAB's respondents seem to have gotten it the most wrong is Perth's Subiaco.
Rather than enjoying "above average capital growth", Subiaco saw, according to Corelogic RP Data, that unit prices decline over 2014 by 6%. There was 1.8% median house price growth over 2014.
CoreLogic RP Data's December figures report that Perth wide, house prices were up 2.1% for the year, while units were up 1.9%.
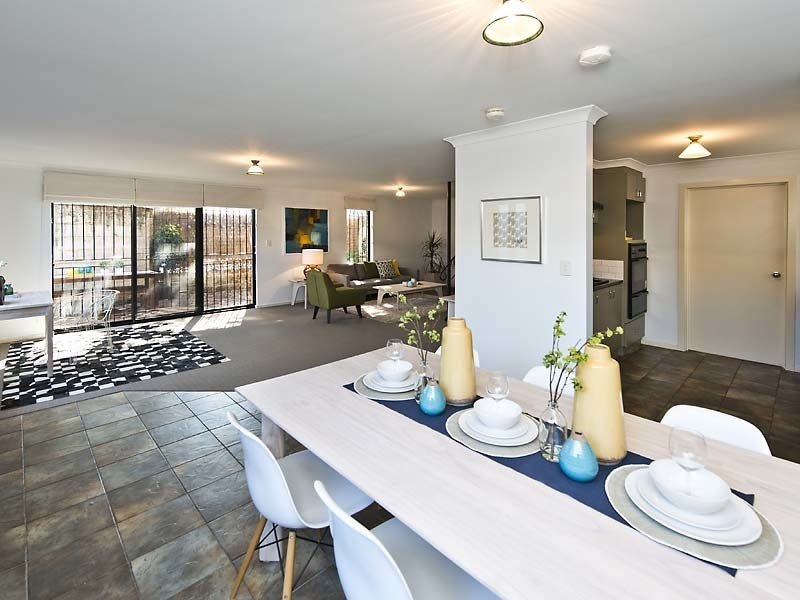
This Subiaco house, at 72 Townshend Road, sold for $810,000 in October last year (pictured below). The price was just 1.8% up from the $795,000 vendors paid for it in 2009.
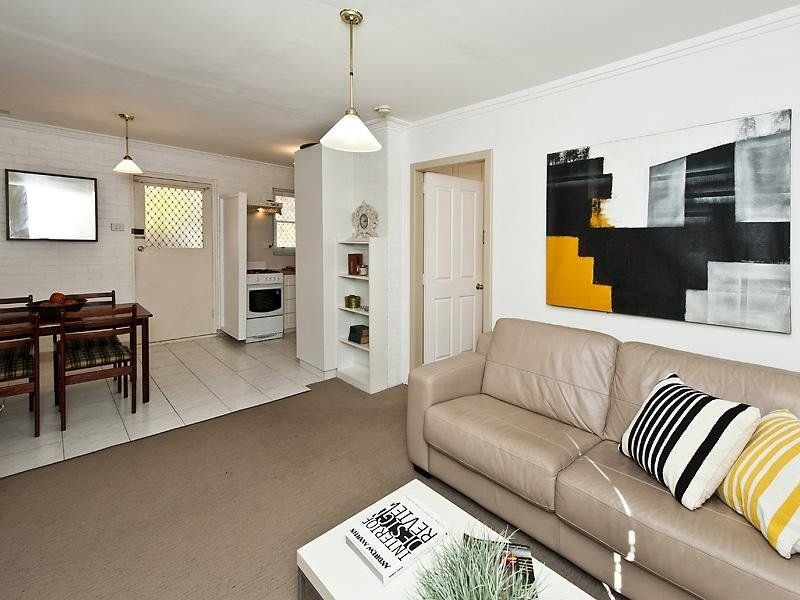
Buyers paid $340,000 for 10/36 Bagot Road in Subiaco (pictured below) in August last year, only $5,000 than vendors paid in 2009 – a difference of just 1.4% over five years, or average annual growth of 0.03%.
However, NAB's respondents certainly did get it right with their pick of Liverpool, in Sydney.
According to CoreLogic RP Data, Liverpool houses recorded 24% median price growth over 2014, well above the city's already impressive average of 13.4%.
The south-western suburb had a median price of $629,000 in December.
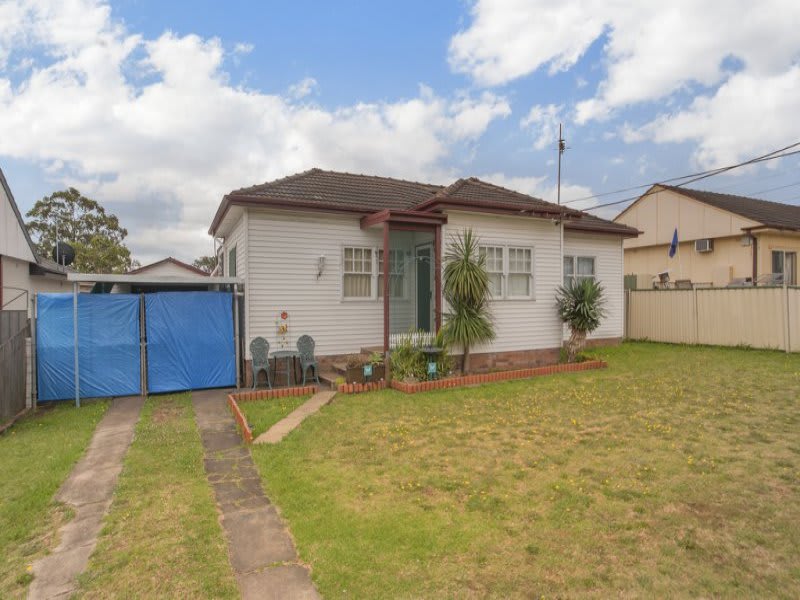
After just six months of ownership, the owners of the Liverpool home pictured below flipped it for $625,000, $89,000 higher than their purchase price of $536,000.
Over 2014, Liverpool's median unit price increased by 12.2%, while Sydney's median unit price was up 8.3% for the same period.
In November last year, the unit at 10/5 Charles Street in Liverpool sold for $115,000 more than its October 2013 purchase price.
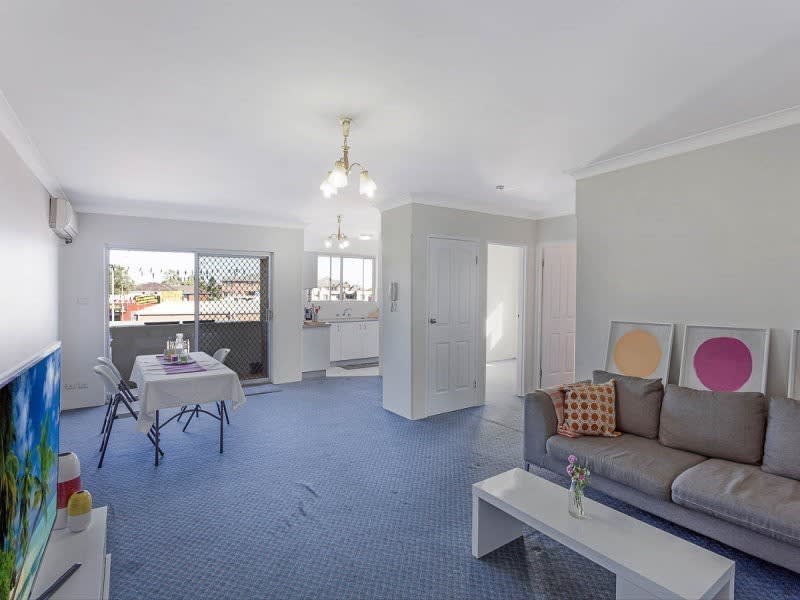
The vendors paid $230,000 for the home in 2013, before trading it for $345,000 in November – a 50% increase in just 13 months.
Here are NAB's Residential Property Survey 2014 picks for above average growth, and their actual 2014 median price capital growth, according to CoreLogic RP Data.
South Australia:
- St Peters
Houses: 5.6%
Units: 0%
Western Australia:
- Mandurah
Houses: 5.6%
Units: 9.8%
- Maylands
Houses: -2.6%
Units: 0.0%
- South Lake
Houses: 4.8%
Unit: 9.9%
- Subiaco
Houses: 1.8%
Units: -6%
Queensland:
- Bulimba
Houses: 16.1%
Unit: 3.9%
- Caboolture
Houses: 3.5%
Unit: -8%
- New Farm
Houses: 9.2%
Unit: 4.2%
- Toowoomba (City)
Houses: 4.7%
Units: -22%
- West End
Houses: 6.6%
Units: 0.4%
New South Wales:
- Blacktown
Houses: 18.7%
Units: 14.9%
- Darlinghurst
Houses: 26.1%
Units: -4.8%
- Dulwich Hill
Houses: 8.1%
Units: 21%
- Liverpool
Houses: 24%
Units: 12.2%
- Marrickville
Houses 11.1%
Units: 13.1%
- Penrith
Houses: 20.9%
Units: 15.1%
- Potts Point
Houses: 0.0%
Units: 3.7%
- Rosebery
Houses: 5.6%
Units: 16.3%
- Surry Hills
Houses: 16.5%
Units: 17.6%
Victoria:
- Cheltenham
Houses: 10.6%
Units: 7.8%
- Frankston
Houses: 6.3%
Units: 4.1%
- Glen Iris
Houses: 9.5%
Units: 3.5%
- Hastings
Houses: 0.9%
Units: 8.6%
- Highett
Houses: 13.9%
Units: 3.1%
- Point Cook
Houses: 3.4%
Units: -13.5%
- Richmond
Houses: 10.3%
Units: -0.2%
- Toorak
Houses: 7.8%
Units: 4.9%