
Dwelling prices rise further in April

Month end - again
Been blinkin' busy of late, and yesterday I was appalled to discover that according to my calendar it's already the start of a new month!
That being the case, with all the usual caveats about why spending too much time looking at monthly and quarterly dwelling price data might not be a smart idea, we can run a few calculations to show what RP Data will report in a few days time as their dwelling price movements for the month, quarter and year to date.
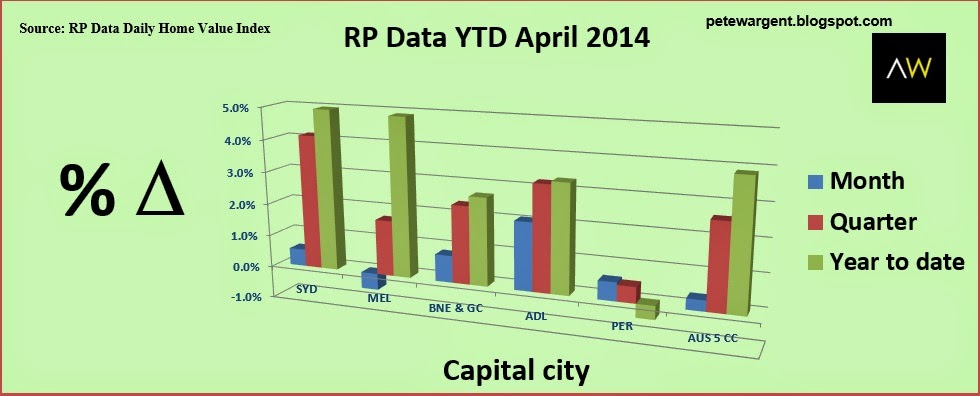
So, nationally dwelling prices were recorded as being +0.3% for the month, +2.6% for the quarter and an extremely strong +3.9% for the 2014 year to date, with the national figures being skewed by exceptionally strong growth in Sydney.
The strongest gains in 2014 have been in Sydney (+5.0%) as we confidently predicted in our 2014 forecasts, with Melbourne just a tick behind (+4.9%).
Forecasting
I also explained in the same article why I'm not a big believer in property price forecasts...particularly those which claim to forecast to one decimal place!
Anyone who tells you that they have a model to predict prices to that level of accuracy is either (a) lying or (b) delusional.
It doesn't matter what econometric model you choose to build, eventually it will blow up due to an unforeseen X factor.
All you can really do is start with borrowing rates, household debt levels, market sentiment and fundamentals, economic and employment forecasts etc. and then build a base case from there.
But think of all the unpredictable events we've seen in recent years - the US sequester and fiscal cliff, the US debt ceiling crisis, Cyprus debt crisis, changes in monetary and fiscal policy...you just can't predict and factor in all that stuff.
So you either make a forecasts with a huge range (e.g. 12% to 30% growth in 2014) or you make a weighted average forecast, accept you'll probably be wrong and risk ending up looking like a total doofus (e.g. our own 6% to 9% in 2014 for Sydney).
As to whether or not Sydney overshoots the top of our expectations? Well, we're only a third of the way through the year, and that remains to be seen.
This all rather contrary to my investment philosophy in any case, which is that property should be seen as a 20-30 year investment decision, and ideally much longer still.
If you're banking on market price movements within a few years, then you're probably in the wrong game.
Other cities
You'll note from the same article that we were generally less optimistic than almost everyone else about property prices in 2014, since we felt that houeshold debt levels were generally too high and annualised wages growth tracking too low to facilitate anything like the levels of nationwide dwelling price growth we've seen in cycles past.
Anyways, back to RP Data's figures.
Melbourne was next up for the year to date (+4.9%), though there's been plenty of chatter around easing auction clearance rates, and RP Data recorded a small fall for the month of April itself (-0.5%).
Some signs of life in Adelaide at last too! - although year-on-year the South Australian capital has still been the worst performing major capital city by a wide margin.
Still, prices have under-performed in Adelaide for so many years that some level of catch-up at last now appears due.
Other providers
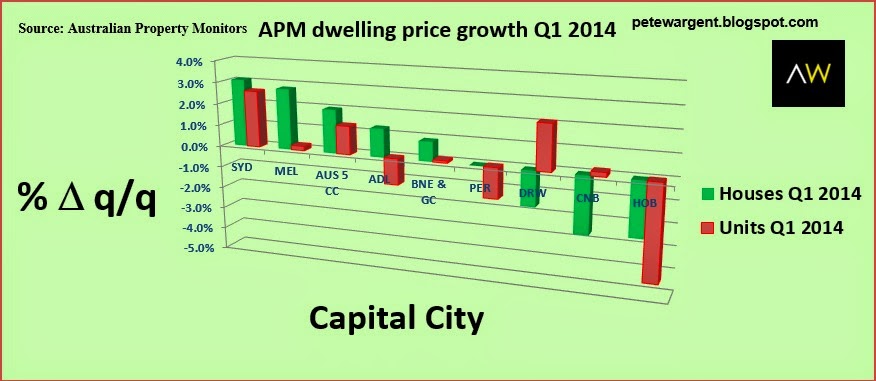
Sydney still clearly leading the recovery, both in terms of houses and apartments. Note, however, that these figures have been impacted by revisions to the December quarter figures. Without the revisions, Melbourne would have recorded extremely strong house price growth of more than 6% in the first quarter.
SQM Forecasts
SQM Research forecast very strong growth of 15-20% in Sydney in 2014.
Natch these forecasts will be benchmarked against a different price series from the Australian Bureau of Statistics (ABS) at the end of the year, but for a bit of light interest as much as anything else, I've been tracking their annual forecasts against RP Data's Daily Home Value Index. A bit of mental gymnastics tells me that since a third of the year has gone and Sydney's dwelling price index has been humming along at 5% YTD price growth, then prices should be tracking right at the bottom end of SQM's forecast range:

And indeed, so they are.
And below are SQM's national forecasts benchmarked against RP Data's index for the first four months of the year.
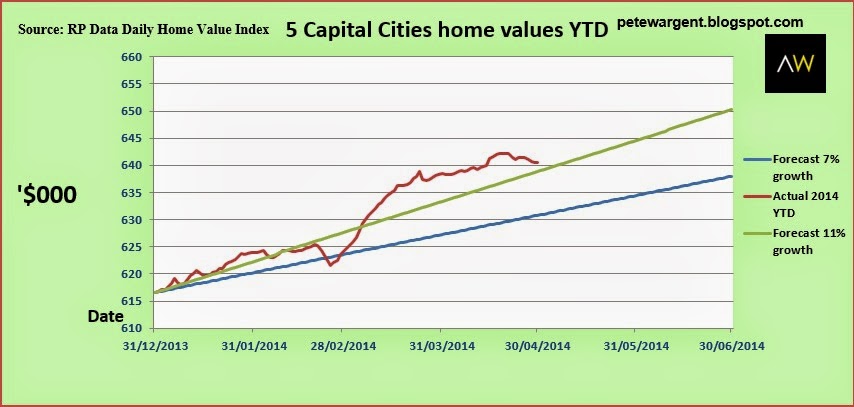
Only a third of the year gone, but at this stage I'd take a bet that their national dwelling price forecast could prove to be bang on the money when benchmarked against the ABS series.
You can visit AllenWargent property buyers (London, Sydney) or Pete's blog.
His new book 'Four Green Houses and a Red Hotel' is out now.