
Residential properties listed for sale in Sydney down 23.1% in a year adding further pressure to house prices: SQM
The number of Sydney properties listed for sale has fallen by almost a quarter in the space of a year with stock levels approaching four-year lows, according to new figures for June compiled by SQM Research.
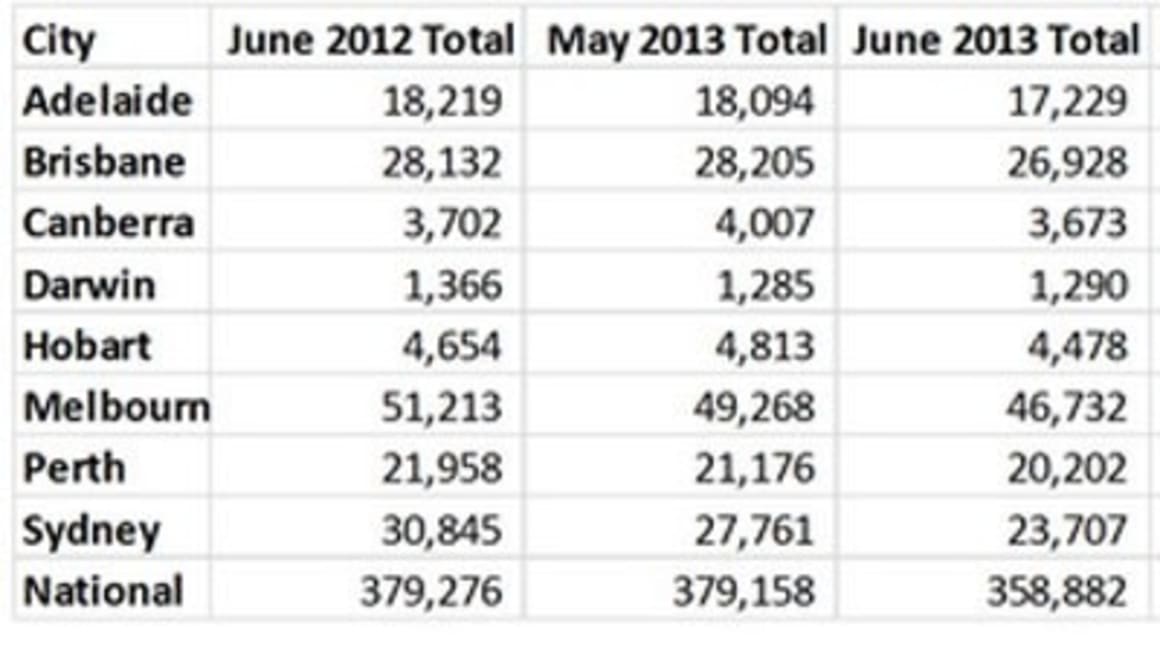
There were 23,707 properties listed for sale in Sydney in June, 14.6% less than in May (27,761) and 23.1% less than the more than 30,000 properties listed for sale the same time last year.
All capital cities recorded expected declines in residential stock in line with the winter slowdown, but Sydney was the only capital city to record a double digit monthly decline and larger annual fall.
A lack of listings could put further pressure on Sydney property prices given the impetus to buy due to low interest rates.
"We're not quite there yet in terms of stock on market, but we are approaching that period of late 2009, early 2010 when Sydney real estate prices were growing at an annual rate of around 15%," SQM Research director Louis Christopher tells Property Observer."Vendors are now increasingly in control of the market and this will put upward pressure on real estate prices.
In September last year, SQM Resarch forecast growth in Sydney house prices in 2013 of between 5% to 9%.
"We are approaching the upper point of that range and 2014 could be a year when capital growth is even higher than that," says Christopher.
He attributes to the large drop in Sydney listings to not a lot of new listings coming to market as well as old stock now being absorbed because prices are rising to meet vendors' expectations.
According to the SQM Research Asking Price Index, asking prices for Sydney houses have risen 7.3% over the past 12 months to June 30 while asking prices for units are up 5.8%.
RP Data-Rismark records a 6.3% rise in Sydney house prices over the past 12 months.
BIS Shrapnel expects Sydney to be the strongest housing market over the next three years with a 19% gain.

Source: SQM Research
Whilere there are less than 24,000 Sydney properties now listed for sale, Melbourne has nearly double the number of properties for sale, more than 46,000 properties for sale, while the much smaller Brisbane market also has more properties listed for sale than Sydney with just under 27,000.“I believe that overall, the national housing market still remains well supplied with current listings, however Sydney is turning out to be a clear exception,” says Christopher.
“When you consider the long term chart, Sydney is approaching the 2009 lows and this fits with other measurements indicating a strengthening housing market for that capital city.”
Behind Sydney, the next biggest monthly decline was Canberra (down 8.3%) while the biggest annual decline was Melbourne (down 8.7%) followed closely by Perth (8%).
Nationally the level of residential property fell by 5.3% over June to a total of 358,882.
Year on year, residential listings are down 5.4%.
“Whilst the majority of capital city monthly decreases can be attributed to seasonal influences and the fact that we came through five weekends in May to four weekends during June, Sydney’s monthly decline of -14.6% in stock appears to have gone beyond these attributes, as we begin to witness stock levels for this capital city that match those seen in 2009,” says SQM Research in its analysis of the data.
“This being the case - combined with Sydney recording a -23.1% yearly decrease in stock, SQM Research believes that we may now be approaching a point where there is a shortage of residential sale listings in the Sydney Market.”