
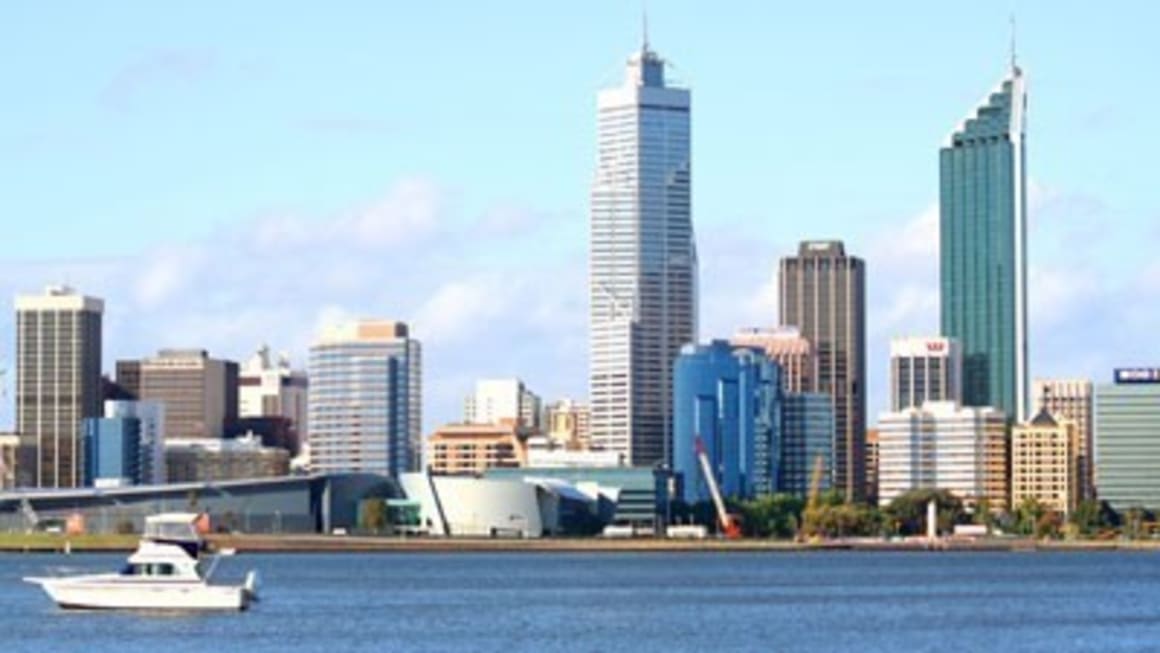
Perth CBD moves up to 20th most expensive market to rent office space in the world: CBRE
An 11.8% annual rise in rents and a 9.9% annual increase in occupancy costs has propelled the Perth CBD into the top 20 most expensive office rental markets in the world, according to the September quarter semi-annual global office report from CBRE.
Perth ranked 20th most expensive prime office market to rent space, with an average rent per square metre cost of $850 and total occupancy costs of $1,003.
Rents and occupancy costs in the Perth CBD have soared on the back of demand for office space from businesses with the ties to the mining investment boom.
The Property Council of Australia recorded a vacancy rate of 4.2% in the Perth CBD in July, down from 7.8% in July 2011, with the city managing a net absorption rate of 115,000 square metres over the first six months of the year – nearly half the national net absorption rate of 243,000 square metres.
Sydney remains Australia’s most expensive prime CBD office market, ranking 14th on the CBRE list, one position up from six months ago. Prime Sydney rents have hardly moved over the past year (up 0.8%) at $1,048 per square metre, while occupancy costs have risen by 1.3% to total average occupancy cost of $1,232 per square metre.
Brisbane ranked 30th on the global list, one up from its ranking at the end of March, with a total occupancy cost of $818, up 1.7%, with rents up 1.3%.
Melbourne ($637 per square metre total occupancy cost) does not feature in the top 50, with the list headed by Hong Kong followed by Central London’s West End, Tokyo, Beijing and New Dehli.
San Francisco, which ranked 26th most expensive office rental market in the world, experienced the largest year-over-year increase, at 36.4%, of the 133 markets monitored by CBRE, driven by its “hot technology sector”.
Top 50 Most Expensive Office Markets as of September 30, 2012
Rank | Market | Occ. Cost (US$) |
1 | Hong Kong (Central), Hong Kong | 246.30 |
2 | London - Central (West End), United Kingdom | 219.81 |
3 | Tokyo (Marunouchi Otemachi), Japan | 197.27 |
4 | Beijing (CBD), China | 184.95 |
5 | New Delhi (Connaught Place - CBD), India | 183.30 |
6 | Beijing (Finance Street), China | 179.57 |
7 | Hong Kong (West Kowloon), Hong Kong | 174.13 |
8 | Moscow, Russian Federation | 172.82 |
9 | London - Central (City), United Kingdom | 131.76 |
10 | São Paulo, Brazil | 130.07 |
11 | Mumbai (Bandra Kurla Complex), India | 122.19 |
12 | Rio de Janeiro, Brazil | 121.40 |
13 | Paris Ile-de-France, France | 119.78 |
14 | Sydney, Australia | 119.04 |
15 | Shanghai (Pudong), China | 116.36 |
16 | New York (Midtown Manhattan), U.S. | 114.30 |
17 | Shanghai (Puxi), China | 108.25 |
18 | Geneva, Switzerland | 105.28 |
19 | Singapore, Singapore | 104.66 |
20 | Perth, Australia | 96.91 |
21 | Caracas, Venezuela | 95.68 |
22 | Washington, DC (Downtown), U.S. | 94.51 |
23 | Dubai, United Arab Emirates | 92.56 |
24 | Seoul (CBD), South Korea | 91.28 |
25 | Mumbai (Nariman Point - CBD), India | 90.80 |
26 | San Francisco (Downtown), U.S. | 90.00 |
27 | Zurich, Switzerland | 87.98 |
28 | Boston (Downtown), U.S. | 87.50 |
29 | Istanbul, Turkey | 82.78 |
30 | Brisbane, Australia | 79.04 |
31 | Luxembourg City, Luxembourg | 77.94 |
32 | Los Angeles (Suburban), U.S. | 76.84 |
33 | Stockholm, Sweden | 76.35 |
34 | New York (Downtown Manhattan), U.S. | 74.93 |
35 | Seoul (Yeouido), South Korea | 74.27 |
36 | Milan, Italy | 74.21 |
37 | Guangzhou, China | 72.88 |
38 | Bogota, Colombia | 70.76 |
39 | Calgary (Downtown), Canada | 70.59 |
40 | Aberdeen, United Kingdom | 70.20 |
41 | Manchester, United Kingdom | 69.80 |
42 | Edinburgh, United Kingdom | 69.02 |
43 | Taipei, Taiwan | 68.57 |
44 | Birmingham, United Kingdom | 68.36 |
45 | Toronto (Downtown), Canada | 68.00 |
46 | Vancouver (Downtown), Canada | 67.20 |
47 | Frankfurt am Main, Germany | 66.31 |
48 | Bristol, United Kingdom | 65.10 |
49 | Oslo, Norway | 64.91 |
50 | Glasgow, United Kingdom | 64.31 |
Source: CBRE Global Research and Consulting
The latest semi-annual prime office occupancy costs survey reveals the dominance of the Asia-Pacific region in the top 10 most expensive business locations worldwide continued, led by Hong Kong-Central – the world’s most expensive market - and five other Asian markets.
Despite economic headwinds, occupancy costs increased by an average of 2.1% worldwide over the past year, led by the Americas, with a 5.2% annual increase and Asia-Pacific with a 2.6% increase. Europe, the Middle East and Africa continued to be hindered by economic recession in much of Europe and recorded a 0.4% decrease in prime occupancy costs. Prime office occupancy costs increased in 74 markets, decreased in 37 office markets and had no change in 22 markets.
“The global office market recovery cooled over the past year, hampered by the ongoing European debt crisis, a deceleration of growth in emerging markets and ubiquitous uncertainty created by the ‘fiscal cliff’ in the US," says Dr Raymond Torto, CBRE’s global chief economist.
“However, tight market conditions, strong demand for high quality space and low levels of new construction continue to drive up occupancy costs in many prime office markets across the globe.”
CBRE tracks occupancy costs for prime office space in 133 markets around the globe.
Of the top 50 most expensive markets, 19 are in EMEA (Europe, Middle East and Africa), 18 are in Asia-Pacific and 13 in the Americas.