Melbourne residential property listings rising four times faster than national average: RP Data

The number of homes listed for sale in Melbourne has increased four times faster than the national average over the past year, according to figures from RP Data.
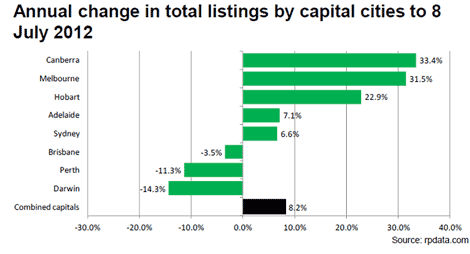
For the year to July 8, Melbourne residential listings have risen 31.5%, compared with a combined 8.2% rise in the capital cities.
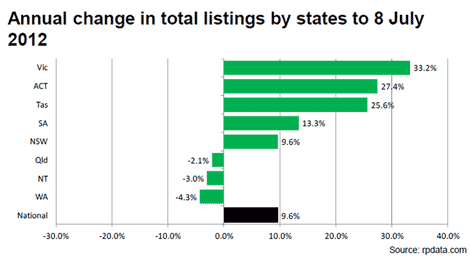
Click to enlargeIt’s a similar picture statewide, with Victorian residential listings increasing by 33.2% over the year to July 8 to 70,124 while nationally they have risen 9.6% to 301,414
Click to enlargeThe RP Data figures break down listings into new listings (those properties that haven’t been advertised over the past six months) and re-listings (properties that have been advertised at least once previously over the past six months).
The Victorian figures show that just 10,147 out of the 70,124 listings are new listings, compared with 9,572 out of 52,633 a year ago.
In comparison NSW are up 9.6% for the year to 78,847 (11,535 are new listings), with a smaller 6.6% rise in Sydney.
The issuance of the residential listing stats from RP Data and SQM Research within 10 days of each other invites comparison.
The SQM Research figures calculate a total of 386,857, which is 85,443 more than the RP Data count.
SQM records a 28% rise in Melbourne listings to just over 52,000 but just a 1% rise in Sydney listings to 32,390.
RP Data figures are based on a direct data feed from “Australia’s largest real estate portal” with duplicates removed and the data cleansed by being matched with the RP Data ownership database.
Outside of Melbourne and Victoria, the RP Data figures show that more properties are being bought and sold in the mining states, with WA recording a 4.6% decline over the past year to 32,851.
Perth residential listing are down more than 11% over the year, while they are down 3.5% in Brisbane and more than 14% in Darwin.
Nationally, new listings have declined by has declined over the past year and are 4.6% lower at 42,473 (8% down across the combined capital cities) and 38.4% lower than the historic peak.
According to RP Data new listings are currently at virtual record low levels, excluding the Christmas and New Year periods.
“Lack of absorption appears to be the issue here,” says RP Data senior researcher Cameron Kusher.
He says transaction volumes are tracking about 13% lower than what was recorded at the same time last year and adds that homes are taking longer to sell; both of these factors are contributing to the higher stock levels.
“An encouraging sign for the market is that conditions are improving with selling times trending shorter over 2012 as well as a subtle improvement in transaction volumes.
“The fact that new listings have also been diminishing is resulting in a reduced level of effective supply,” says Kusher.

