Interest rate cuts starting to stimulate house prices: Christopher Joye
Have the RBA’s relentless rate cuts had any impact on Australia’s housing market? Today we are going to find out.
One of the important benefits of the new “daily” RP Data-Rismark house price index suite is that we get very timely updates on the current market pulse. I am going to use these indices to look at the performance of both the national market and some of the individual capital cities. Before I do, a word on the underlying data.
When analysts think about house price data they typically do so from two perspectives. The first asks the question: what is happening to “actual” prices; that is, the prices that home owners transact at. The second queries how house price movements compare to similar periods over time; more specifically, this approach seeks to strip out the strong “seasonality” that house prices display at various points during the year.
Both techniques have their merits. Indeed, analysts should always be mindful of the two. On the one hand, there is an argument that we do not normally “seasonally adjust” asset price (or financial market) data, such as stocks, bonds, or commercial property prices. So if you want to measure actual or realised investment returns, you must use the raw housing data.
On the other hand, analysts also want to understand whether current market dynamics are unusually strong or weak. For example, Australian house prices normally fall in the month of December. Accordingly, price declines in December do not actually signal a deteriorating market. This is just what usually happens when the market shuts down over the Christmas break. By seasonally adjusting the December data, we can arrive at more sophisticated conclusions as to the market dynamics at that particular juncture.
In Australia, the housing market becomes seasonally weak during the winter months of May through August, inclusive. With this observation in mind, I will leverage off the raw house price indices for today’s purposes.
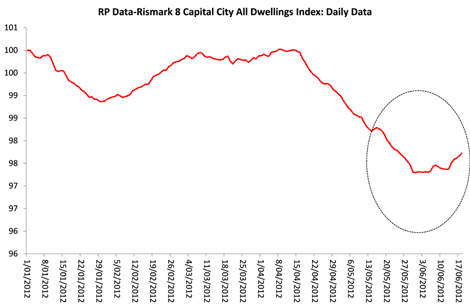
In my first chart, I have illustrated the national, eight capital city, “all dwellings”, index. This shows us the change in the value of the housing stock, including both detached homes and units, across all the capital cities on a value-weighted basis. And we can identify four distinct market phases in the year-to-date.
Click to enlargeOver the month of January national dwelling values declined by about 1%. They then fully recovered this loss over the seasonally robust months of February and March. Indeed, homes values continued grinding out gains through to the 15th of April.
Now recall that the RBA cut rates in November and December. Yet the banks unilaterally jacked rates back up in February by 10 to 15 basis points, and one of the major banks, ANZ, hiked by another 15 basis points in the middle of April.
So before the May rate cuts, Australian borrowers had been effectively subject to an interest rate increase over the first four months of the year, which arguably did much to diminish the impact of the December relief.
As we can see from the chart above, Australian home values weakened noticeably from mid-April through to the end of May. This is not overly surprising. While the RBA cut rates by a super-sized 50 basis points on 1 May, the major banks did not respond until the end of the second week of the month. And many lenders delayed the introduction of the actual rate reductions until the end of the month.
Rightly or wrongly, the RBA followed up the May cuts with a third in June. And we can see in the chart that it was at this time – or, more exactly, at the end of May – that Australian home values started grinding out capital gains again. The fact that house prices have been rising in June is especially encouraging given the typically adverse seasonality that grips during the winter period.
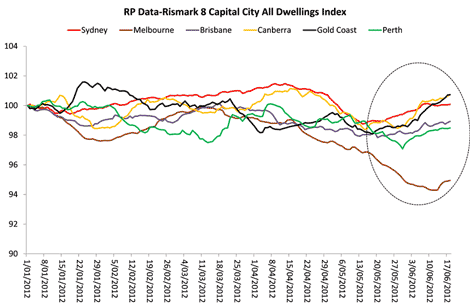
What about the individual capital cities? My second chart displays the index data for Sydney, Melbourne, Brisbane, Canberra, the Gold Coast and Perth.
Click to enlargeThere are probably three things to take away from this. First, far and away the worst performer has been Melbourne, which as our second largest city, has been dragging down the national numbers. There are, however, some tentative signs that Melbourne values are stabilising.
The second point of note is that all cities included in the chart, and notably Brisbane and the Gold Coast, have recorded synchronous recoveries since in or around the end of May. As I have highlighted before, Sydney’s market led the charge, reacting most quickly to the May rate cuts.
Crucially, home values in the Gold Coast, Sydney and Canberra are all higher than they were at the end of 2011. Brisbane and Perth home values are down very slightly, while Melbourne is evidently still digesting the extraordinary 35% growth in capital values over 2009 and 2010. In the year-to-date Melbourne values are down a chunky 5%, although they have started inflating again in June.
Rismark’s latest forecasts for the national housing market imply that home values will be broadly flat over 2012, albeit with some cross-sectional diversity. Rents, in contrast, are expected to rise at a healthy pace, which means that yields should also continue to increase.
There are grounds for optimism over the remainder of the year. Today borrowers can avail themselves of historically very low mortgage rates: lenders like UBank are offering 5.62% per annum variable rate loans, while you can fix your rate for three years at just 5.75% per annum.
As I have demonstrated in previous columns, the vast bulk of the overall losses in Australia’s housing market since the start of 2011 have been concentrated in the “luxury” segments. This is in turn being driven by the permanent downward shift in the earnings expectations of financial services employees, who benefited from 20 years of extraordinary growth prior to the onset of the GFC.
This dynamic is akin to a company that suddenly downgrades its future cashflow projections – the stock price will fall accordingly. In the ultra-luxury $3 million-plus markets, participants are witnessing very steep valuation adjustments. Eventually asset prices in these areas will find a base.
Yet the median home owner in Australia is buying a property worth about $400,000 while more than 80% of all sales are for dwellings priced less than $700,000. Across the mass housing market, capital losses since January 2011 have been very modest at less than 3%.
Christopher Joye is a leading financial economist and a director of Yellow Brick Road Funds Management and Rismark. The author may have an economic interest in any of the items discussed in this article. These are the author’s personal views and do not represent the opinions of any other individual or institution. This material is not intended to provide, and should not be relied upon for, investment advice or recommendations.


