
The coronavirus's economic toll in numbers: Guy Debelle

EXPERT OBSERVER
The December quarter national accounts confirmed our assessment that the Australian economy ended 2019 with a gradual pick-up in growth.
Growth over the year was 2¼ per cent, up from a low of 1½ per cent.
Consumption growth was a little stronger in the quarter, although still subdued.
We had estimated that the bushfires will subtract around 0.2 percentage points from growth across the December and March quarters, but besides that, economic growth was set to continue to pick up supported by low interest rates, the lower exchange rate, a rise in mining investment, high levels of spending on infrastructure and an expected recovery in residential construction.
On the global side, around the turn of the year there were indications that the global economy was coming out of a soft patch of growth. The trade tensions between China and the US had abated, surveys of business conditions were picking up and industrial production was improving.
Financial conditions were very stimulatory and supporting the pick-up in global growth.
Since then, there is no doubt that the outbreak of the virus has significantly disrupted this momentum, initially in China and now more broadly.
We do not have a clear picture yet on the disruption to the Chinese economy caused by the virus and the measures put in place to contain the virus. But the following two graphs provide some sense of the significant disruption to the Chinese people and economy.
The coal consumption graph (Graph 1) shows the regular significant decline in production around Chinese New Year. But this year, the return to normal production has been significantly delayed.
There was no ramp up in production after the holiday period, and we are now more than four weeks past the point where the Chinese economy is normally back to full-scale production.
The straight arithmetic of losing a substantial amount of output over a period of several weeks implies a significant hit to economic activity.
The road congestion graph (Graph 2) tells a similar story of a protracted period of low output.


Both show that the Chinese economy is now only gradually returning to normal.
Even as this occurs, it is very uncertain how long it will take to repair the severe disruption to supply chains.
In the meantime, the virus has spread to other countries.
They too are beginning to suffer significant disruptions, the extent and duration of which is unknown at this time.
The conclusion is that the global economy will be materially weaker in the first quarter of 2020 and in the period ahead.
In terms of the effect on the Australian economy, we have estimated the direct impact on the education and tourism sectors in the March quarter.
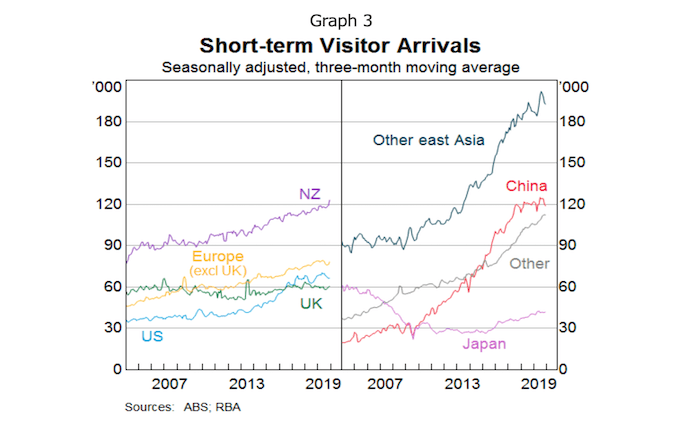
Graph 3 shows the normal profile of visitor arrivals into Australia.
Since January, inbound airline capacity from China has declined by 90 per cent, which gives a guide to the size of the decline in arrivals from China.
Up until recently, tourist arrivals from other countries had held up reasonably well but that may no longer be true.
From our liaison with the education sector, including the universities, as well as student visa numbers, we have information on the number of foreign students who have been unable to resume their studies.
Graph 4 shows the country of origin of foreign students in Australia.
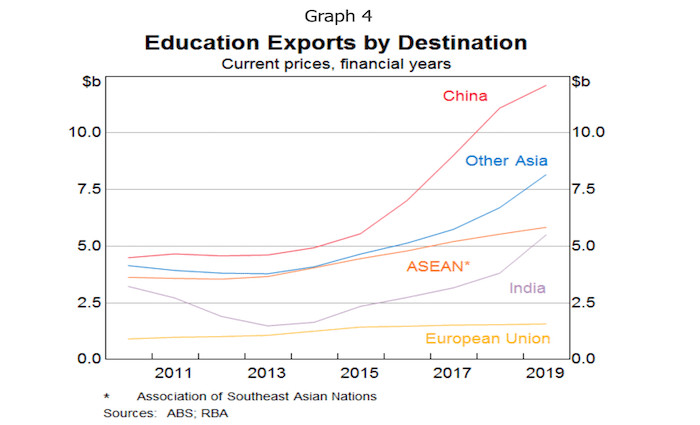
We have used this information to estimate the impact of the virus in these two sectors of the economy.
The estimate is approximate, but at this stage we think the decline in services exports in the March quarter will amount to at least 10 per cent, roughly evenly split between lower tourism and education exports.
As service exports account for 5 per cent of GDP, this translates into a subtraction from growth of ½ per cent of GDP in the March quarter from these two sources.
Through our business liaison program we are gathering information on supply chain disruptions which are affecting the construction and retail sectors in particular.
Clearly we are still only in the early weeks of March, so the picture can change from here.
It is just too uncertain to assess the impact of the virus beyond the March quarter.
Our liaison with the resources sector does not indicate any material disruption to exports of iron ore and coal at this stage.
Indeed, iron ore and coal prices have been resilient.
Disruptions to Chinese domestic production of iron ore and coal have been a factor in this, which has resulted in more use of imported resources.
Another is the expectation that the Chinese policy response will involve a significant amount of infrastructure spending which will benefit bulk commodities.
The movements in these commodity prices stand in contrast to the large decline in the oil price, which will flow through to LNG prices (Graph 5).

I will now summarise recent developments in financial markets.
There has been a large increase in risk aversion and uncertainty.
The virus is going to have a material economic impact but it is not clear how large that will be. That makes it difficult for the market to reprice financial assets.
Policy interest rates have been reduced in some countries, including Australia, and further reductions are expected where that is possible. Currently market pricing implies a reduction of between 75 and 100 basis points in the Fed's policy rate at their meeting next week.
Government bond yields have declined to historic lows, because of the shift downwards in actual and expected policy rates, reduced expectations for growth and a flight to safety (Graph 6).
The 25 per cent fall in oil prices on Monday morning has also led to lower expectations of inflation.
The 10 year US treasury yield reached a low below 35 basis points on Monday, including a 25 basis point decline at the opening of trade in Asia.
It has since risen to be around 65 basis points at the time of writing.
Australian government bond yields have been driven by the global developments.
They haven't declined as much as US Treasuries, such that the spread between the 10 year yields is now slightly positive, having been negative over the past two years.
At the time of writing, the Australian government can borrow for 10 years at 75 basis points.

Equity prices have fallen by as much as 20 per cent since their all-time peak of less than a month ago, although the Australian market rebounded on Tuesday (Graph 7).
The falls have been particularly large for companies in the oil sector, as well as tourism.

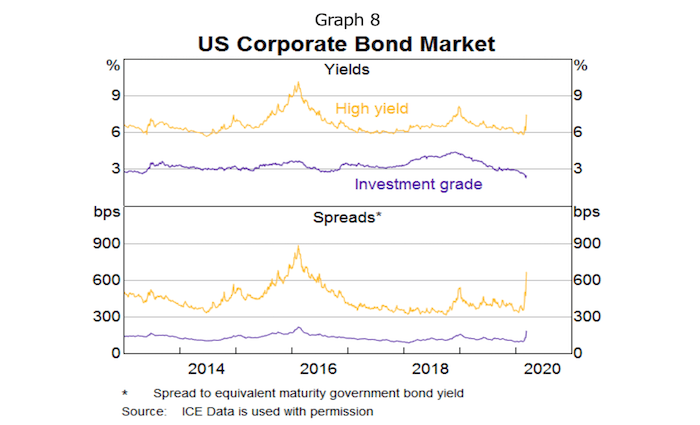
Corporate bond spreads have widened.
Through the first part of this move, the widening in large part reflected the rapid shift downwards in the risk free (government bond) curve.
Investment grade bond spreads widened but investment grade yields actually fell (Graph 8). In the last few days though, we have seen yields rise along with the spreads.
The high yield sector has seen a marked rise in yields and spreads, particularly in the US reflecting the prevalence of energy companies in that market.
Bond issuance has been extremely low, in part because issuers do not want to appear to be in desperate need of funds in a dislocated market.
It is also worth noting that just as equities prices have fallen from historic highs, so too have corporate bond prices fallen from historic highs.
Liquidity in fixed income markets has been poor at times, including in US Treasuries.
The liquidity environment has changed considerably in the past decade in response to changed regulations. The banking sector is much less willing and able to warehouse risk and provide liquidity than in the past.[2]
The Australian banking system is well capitalised and is in a strong liquidity position.
The Australian banks had raised a significant amount of wholesale funding before the disruption to markets and deposit inflows are robust.
They are resilient to a period of market disruption.
Spreads on Australian bank bonds have widened, although yields remain at levels that are still very low historically.
We have not seen any particular sign of pressure in our daily market operations to date.
The spread between the bank bill swap rate and the expected policy rate (OIS) has risen in recent days but remains low, nothing at all like what occurred in GFC.
Exchange rate volatility has been very low for a considerable period of time, but has picked up in the past few days.
However it still remains considerably lower than volatility in other financial markets.
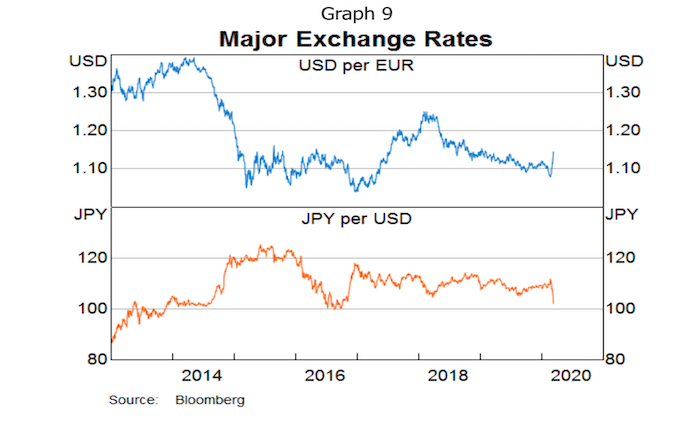
The yen has appreciated by as much as 10 per cent against the US dollar, as Japanese investors repatriate funds, as normally occurs in these type of situations (Graph 9).
More surprisingly, the euro has also appreciated against the US dollar.
Market intelligence indicates that part of the reason for this is the liquidation of trades that were funded in euros and invested in higher yielding assets such as emerging market bonds.
The sharp narrowing in the interest differential with the US has also contributed.
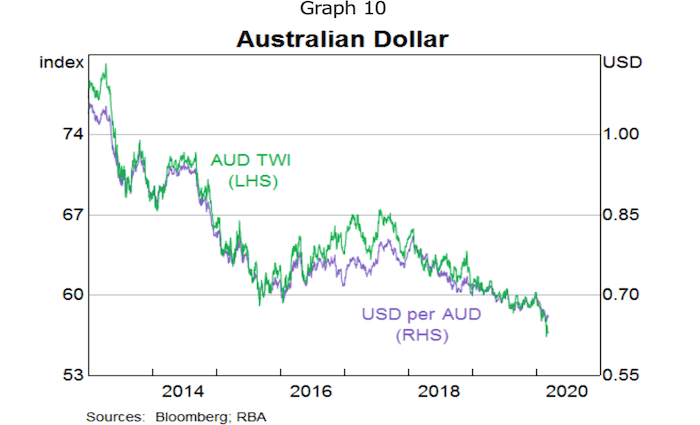
The Australian dollar has depreciated by 6 per cent since the beginning of the year to decade lows against the US dollar and on a trade-weighted basis (Graph 10).
This will provide a helpful boost to the Australian economy and has occurred despite the prices of the bulk commodities, iron ore and coal, remaining resilient.
Turning to monetary policy, the Board met last week and decided to lower the cash rate by 25 basis points to 0.5 per cent.
This decision was taken to support the economy by boosting demand and to offset the tightening in financial conditions that otherwise was occurring.
The reduction in the cash rate at the March meeting was passed in full through to mortgage rates.
The cash rate has been reduced by 100 basis points since June.
This has translated into a reduction in mortgage rates of 95 basis points.
This has occurred through the combination of a reduction in the standard variable rate of 85 basis points, larger discounts to new borrowers and existing borrowers refinancing to take advantage of larger discounts.
While a lower and flatter interest rate structure puts pressure on bank margins, it is important to remember that the easing in monetary policy will help support the Australian economy which in turn supports the credit quality of the banks' portfolios of loans.
The virus is a shock to both demand and supply.
Monetary policy does not have an effect on the supply side, but can work to ensure demand is stronger than it otherwise would be.
Lower interest rates will provide more disposable income to the household sector and those businesses with debt. They may not spend it straight away, but it brings forward the day when they will be comfortable with their balance sheets and resume a normal pattern of spending.
Monetary policy also works through the exchange rate which will help mitigate the effect of the virus' impact on external demand.
The effect of the virus will come to an end at some point.
Once we get beyond the effect of the virus, the Australian economy will be supported by the low level of interest rates, the lower exchange rate, a pick-up in mining investment, sustained spending on infrastructure and an expected recovery in residential construction.
The Government has announced its intention to support jobs, incomes, small business and investment which will provide welcome support to the economy.
The combined effect of fiscal and monetary policy will help us navigate a difficult period for the Australian economy.
They will also help ensure the Australian economy is well placed to bounce back quickly once the virus is contained.
GUY DEBELLE is the Deputy Governor of the Reserve Bank of Australia