
Subdued business investment, healthy home prices: CommSec's Savanth Sebastian

However the main good news or rather glimmer of hope was the lift in expected investment plans compared with last quarter. The fourth estimate for 2016/17 is $106.9 billion, up 1.7 per cent on the third estimate (June quarter). In addition investment plans have lifted substantially in the past six months, up by 17 percent.
Encouragingly the lift in investment plans over the last couple of quarters, may be a sign of a shift in momentum by the business sector, but it is too early to tell. Certainly the lift in business conditions in recent months may be supportive of a lift in investment plans – especially in light of the surge in commodity prices and improvement in the global economy. No doubt the rebalancing across the economy is also being supported by the slide in the Australian dollar – an outcome that should garner further traction in coming quarters. But as we have seen in the past, business may plan for future investment but then mothball projects if the economic landscape doesn’t improve.

Overall policymakers will keep a close eye on the housing sector the early part of 2017, and will prefer to see more balanced house price growth across the nation. And in particular a lift in regional house prices would be a positive outcome. Annual growth in home prices across regional centres was just 1.4 per cent over the past 12 months.
What do the figures show?
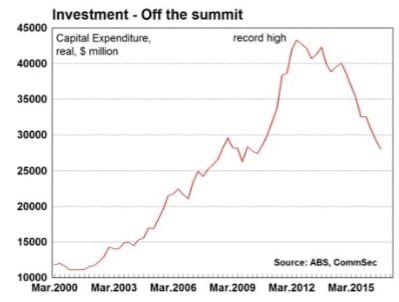
Private business investment
Overall: Business investment (spending on buildings and equipment) fell by 4 per cent in the September quarter after falling by 5.2 per cent in the June quarter. Spending on buildings fell by 5.7 per cent in the quarter while spending on equipment fell by 1.9 per cent. Investment is down 13.7 per cent over the year with buildings down by 24.3 per cent while equipment was up by 4.6 per cent.
Sectors: Mining investment fell by 7.2 per cent in the September quarter (ninth straight decline), while manufacturing spending fell by 4.9 per cent, spending by “other selected industries” fell by 1.9 per cent.
States: In seasonally adjusted terms investment fell in six of the eight states and territories in the September quarter. Investment fell the most in Western Australia (down 11.4 per cent), followed by Northern Territory (down 10 per cent), the ACT (down 8.1 per cent), South Australia (down 4.8 per cent), NSW (down 3.5 per cent), and Tasmania (down 0.1 per cent). The only rise was in Victoria (up 3.3 per cent) followed by Queensland (up 2.7 per cent).
Prices: The overall deflator for investment goods fell by 0.3 per cent in the September quarter after falling by 0.5 per cent in the June. The cost of buildings and structures rose by 0.2 per cent while the cost of equipment fell by 0.8 per cent. Over the year, the cost of investment goods fell by 0.5 per cent – the largest fall 41⁄2 years. The cost of buildings rose by 0.9 per cent while the cost of investment equipment fell by 3 per cent.
Forecasts: The fourth estimate for investment in 2015/16 is $106.9 billion, up 1.7 per cent on the third estimate but down 14.3 per cent over the year. Over the last six months, investment expectations have lifted by 17.1 percent.
Home prices
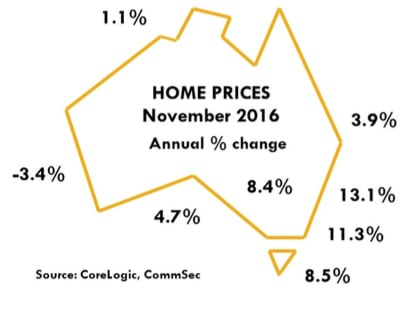
The CoreLogic Home Value Index of capital city home prices rose by 0.2 per cent in November and was up 9.3 per cent over the year.
In regional Australia, house prices fell by 0.2 per cent in October and were just 1.4 per cent higher than a year ago. (regional prices cover just houses and data is up to the end of October).In capital cities, house prices rose by 0.2 per cent in November while apartment prices fell by 0.1 per cent. House prices were up 9.6 per cent on a year ago and apartments were up by 7.2 per cent.
The average Australian capital city house price (median price based on settled sales over quarter) was $645,000 and the average unit price was $540,000.
Total returns on capital city dwellings in the year to November rose by 13.1 per cent with houses up 13.3 per cent on a year earlier and units up 11.8 per cent.
Performance of Manufacturing
The Performance of Manufacturing index rose by 3.3 points to 54.2 in November. A reading above 50.0 indicates that the sector is expanding. The index had been above 50 for 13 months up until August 2016 – the longest period of expansion since September 2006.AIG notes “The expansionary conditions were broad-based, with six of the seven sub-indexes in the Australian PMI indicating expansion in November. The strong lift in new orders (59.5 points) together with solid growth in sales (53.5 points) is promising.”
What is the importance of the economic data?
“Private New Capital Expenditure and Expected Expenditure” is released quarterly by the Bureau of Statistics. The figures show both actual and expected spending by businesses on tangible assets such as new buildings, machinery and office equipment. The figures are obtained after sampling 8,000 private business units.
The CoreLogic Hedonic Australian Home Value Index is based on Australia’s biggest property database. Unlike the ABS Index, which excludes terraces, semi-detached homes and apartments, the CoreLogic Hedonic Index includes all properties. Home prices are an important driver of wealth and spending.
The Australian Industry Group compiles the Performance of Manufacturing Index (PMI) each month. The Australian PMI is the Australian equivalent of the US ISM manufacturing gauge. The PMI is one of the timeliest economic indicators released in Australia. The PMI is useful not just in showing how the manufacturing sector is performing but in providing some sense about where it is heading. The key ‘forward looking’ components are orders and employment.
What are the implications for interest rates and investors?