RBA graphs highlight growing savings culture
The growing trend of households saving more and deleveraging has been highlighted in the latest set of economic and financial market graphs released by the RBA.
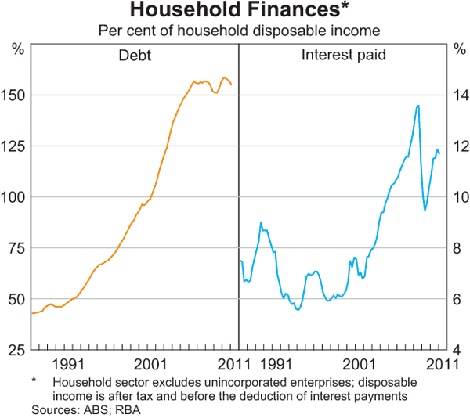
Updated to September 1, the graphs show the proportion of household income being used to pay off interest starting to head down after decades of debt build-up at the same time as household debt levels continue to decline.
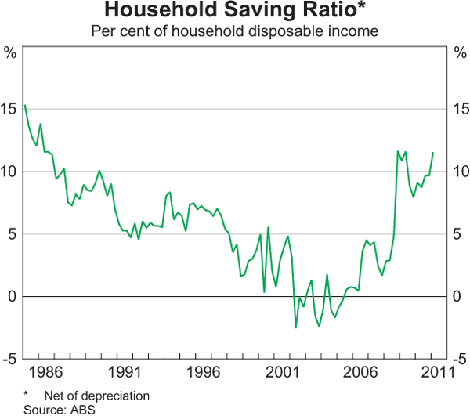
At the same time households continue to increase their level of savings with a sharp rise recorded in the last few months.
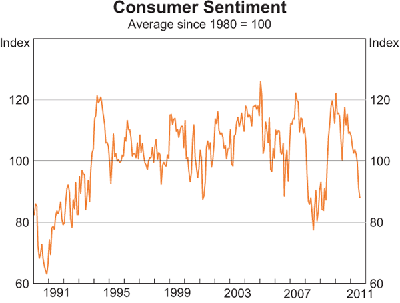
The downturn in consumer sentiment is starkly revealed in the following graph, with current sentiment now well below the average:
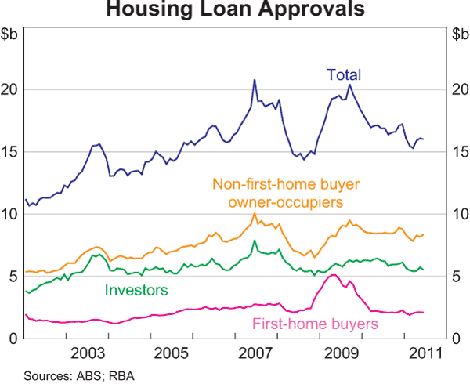
There are some positive indicators, with mortgage approvals starting to trend upwards among owner-occupiers and first-home buyers.
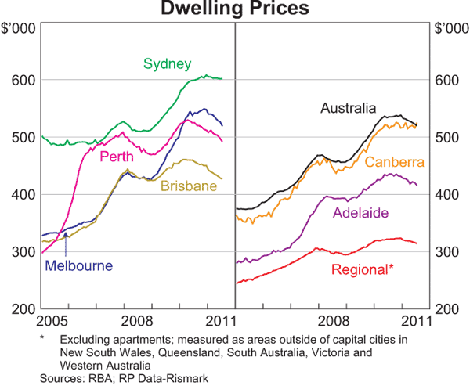
The decline in house prices over the last year can be clearly seen in this comparative chart, with noticeably steeper declines for Melbourne, PERTH and Brisbane.
