
Sydney prices may ease a little further: CommSec

The CBA/Markit Manufacturing index rose from 55.4 to 55.6 in February. The Australian Industry Group manufacturing index eased from 58.7 to 57.5 in February. Readings above 50.0 indicates that the manufacturing sector is expanding.
Home price data is important for retailers, especially those focussed on consumer durables. The manufacturing data provides guidance for companies in the Industrials sector.
What does it all mean?
Housing is all about supply and demand. Demand for homes is strong in Hobart, outpacing supply, and prices are rising. In contrast, the previously high-flying Sydney market is experiencing a correction in prices. More new homes are on the market, giving buyers greater choice. As a result, prices are adjusting to more realistic and sustainable levels. Home prices in Sydney are now lower than a year ago.
The rebalancing of the housing market should be closely watched, but it is not a cause for concern. Supply and demand are always in adjustment in housing markets
Sydney prices may ease a little further and Melbourne prices also have potential to soften over 2018.
There are more anecdotes of “rent-vesting” occurring where young people from Sydney and Melbourne are buying in other capital cities and regional areas and using rent proceeds to offset their costs of leasing in inner-city Sydney and Melbourne.
Latest survey data shows that the manufacturing sector is in strong shape. As always, the focus now is to gauge whether wage and price pressures are starting to creep through.
Ai Group said “many manufacturers are now looking to employ more staff but are finding it difficult to find skilled workers for their locations or specialisations”.
Click here to enlarge.
What do the figures show?
Home prices
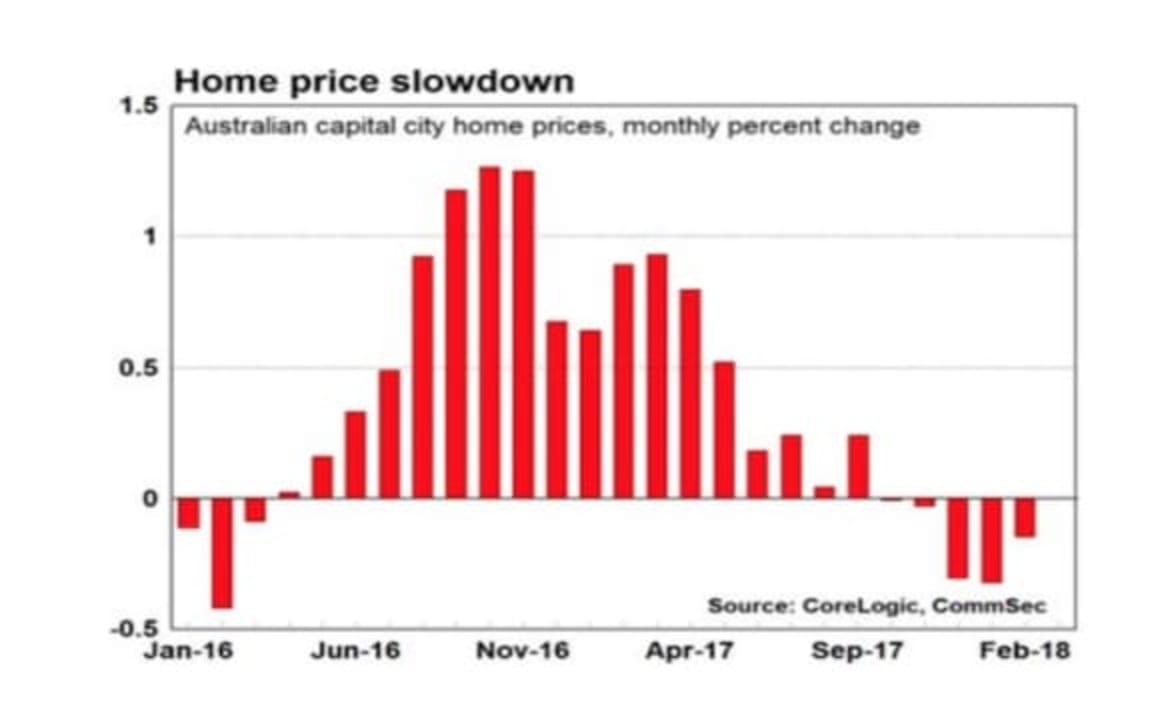
The CoreLogic Home Value Index of capital city home prices fell by 0.3 per cent in February to stand 2.0 per cent higher over the year.
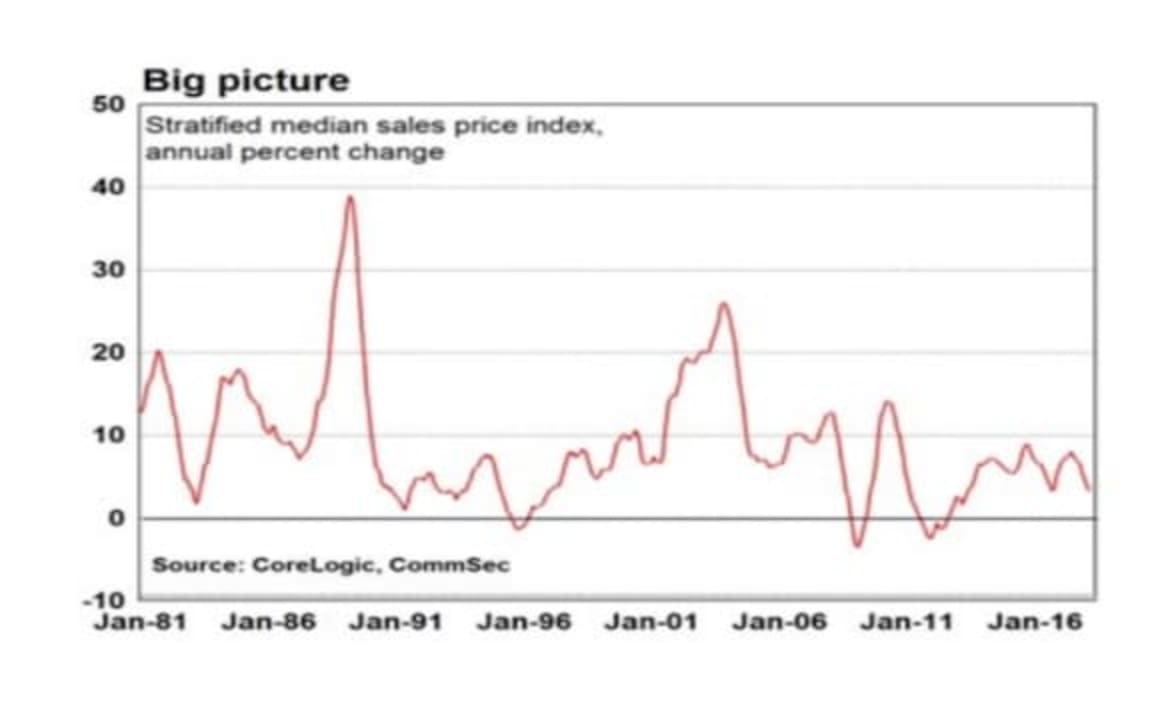
The national home price index fell by 0.1 per cent in February to be up 2.2 per cent over the year. It was the smallest annual growth in national prices in 18 months.
In capital cities, house prices fell by 0.4 per cent in February and apartment prices were flat. House prices were up 1.5 per cent on a year ago and apartments were up by 4.3 per cent.
In regional areas, home prices rose by 0.4 per cent in February to be up 2.8 per cent on the year.
Click here to enlarge
The average Australian capital city house price (median price) was $694,478 and the average unit price was $578,244.
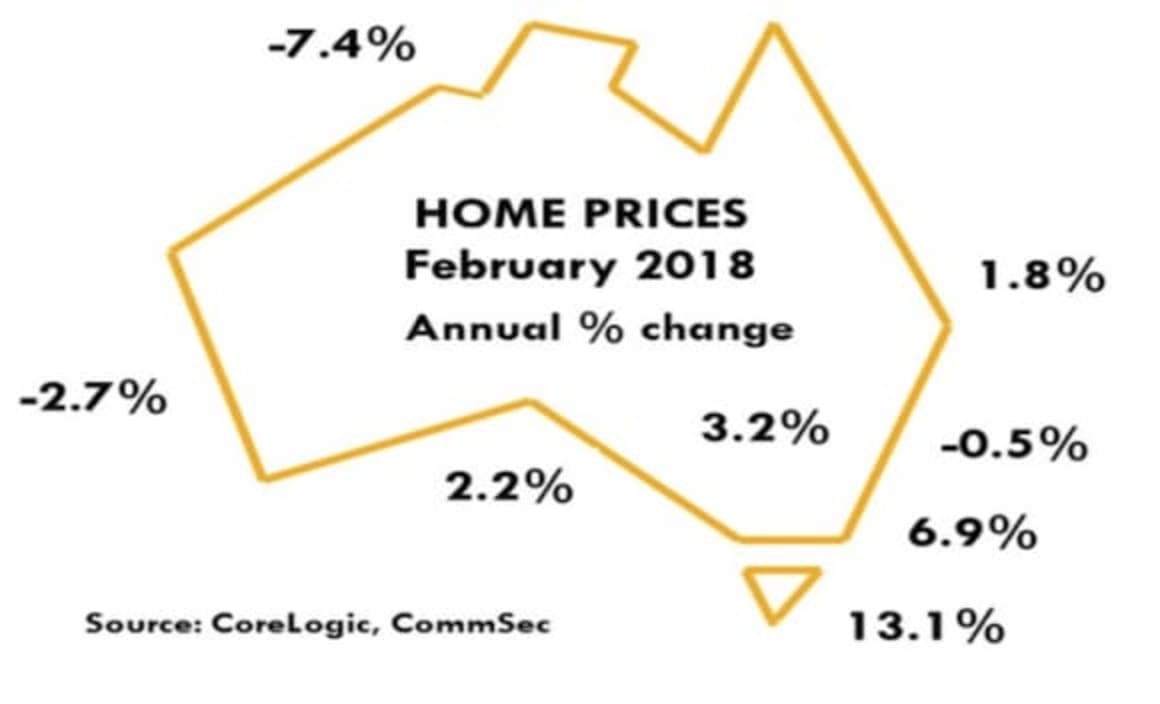
Dwelling prices fell in six of the eight capital cities in February: Home prices fell in Darwin (down 0.9 per cent) from Sydney (down 0.6 per cent), Canberra (down 0.3 per cent), Perth (down 0.2 per cent) and Melbourne and Brisbane (both down 0.1 per cent). Prices were flat in Adelaide. Prices rose 0.7 per cent in Hobart.
Home prices were higher than a year ago in six of the eight capital cities. Prices rose most in Hobart (up 13.1 per cent); followed by Melbourne (up 6.9 per cent); Canberra (up 3.2 per cent); Adelaide (up 2.2 per cent); Brisbane (up 1.8 per cent). Prices fell in Darwin (down 7.4 per cent), Perth (down by 2.7 per cent) and Sydney (down by 0.5 per cent).
Total returns on capital city dwellings rose by 5.4 per cent in the year to February with houses up 4.6 per cent on a year earlier and units up 7.7 per cent.
Click here to enlarge.
Manufacturing Purchasing Managers’ Indexes
The CBA/Markit Manufacturing index rose from 55.4 to 55.6 in February. Readings above 50.0 indicate that the sector is expanding.
CBA/Markit notes: “Australian manufacturers are benefiting from the positive global backdrop. New export orders were up sharply in February. This extra demand is driving strong jobs growth. But capacity pressures remain evident in the rundown of finished goods stocks, lengthening supplier delivery times and rising backlogs of work. Rising input and output prices are one outcome.”
The Australian Industry Group manufacturing index eased from 58.7 to 57.5 in February. The month of February marked the 17th month of expanding or stable conditions for the manufacturing sector.
Ai Group said that all of the seven activity subindexes contained in the report improved in February.
“This marks a fourth consecutive month in which all seven activity sub-indexes have expanded,” the group said.
“Five of the seven activity indexes slowed in February, however, with only the employment and exports sub- indexes accelerating.”
What is the importance of the economic data?
The CoreLogic Hedonic Australian Home Value Index is based on Australia’s biggest property database. Unlike the ABS Index, which excludes terraces, semi-detached homes and apartments, the CoreLogic Hedonic Index includes all properties. Home prices are an important driver of wealth and spending.
The Australian Industry Group compile the Performance of Manufacturing Index and Performance of Services index each month. CBA and Markit also compile purchasing manager surveys for manufacturing and services sectors. The surveys are amongst the timeliest economic indicators released in Australia.
The surveys are useful not just in showing how key sectors are performing but also in providing some sense about where they are headed. The key ‘forward looking’ components are orders and employment.
What are the implications for interest rates and investors?
In the housing sector, prices of established homes are easing in many parts of the country. In the manufacturing sector there are reports of skilled shortages, potentially leading to higher wages and prices. Welcome to 2018 where the world is on watch for higher inflation rates despite mixed messages.
CommSec expects official interest rates to be stable until late 2018. But as always, the outlook for rates is data dependent. It will be a case of monitoring each economic indicator very closely to see if there are signs of inflationary pressures emerging.
Craig James is the chief economist at CommSec.