
Very buoyant market to deliver strong growth: Arek Drozda's March state of the market analysis

Market outlook: neutral (upgraded to reflect positive turnaround in several indicators).
- Renting and buying are now equally balanced options (as at March 2015).
- Purchase affordability has improved again (as at March 2015).
- Confidence in the economy is low but potentially at a turnaround point (as at March 2015).
- Housing Credit Impulse points again to a stronger demand for real estate (as at March 2015).
- Prices are elevated in relation to mortgage credit flow but can be sustained without problems if flow of funds into the market continues (as at January 2014).
National Real Estate Price Forecast
The year has started with a renewed optimism about the Australian residential property market after a period of noticeable slowdown in the second part of 2014.
January property finance figures were very strong, and that was even before the interest rate cut.
In February, RBA reset the overall market conditions by reducing interest rates to a historically low 2.25%.
In an environment where growth in prices was slowing and where incomes were progressing at a steady, albeit moderate, pace it resulted in a significant improvement in purchase affordability.
The reset in purchasing costs increased the attractiveness of buying, when compared to the second half of 2014.
In addition, there are signs that negative expectations about the economy are ready for a reversal (the raw measure turned up in November 2014 and is rising).
All in all, the March quarter estimates point to a very buoyant market. If current enthusiasm can be sustained and continues into the autumn selling season, 2015 can be expected to deliver another year of solid growth in property prices.
We will have to wait until the next set of figures are released to confirm whether this positive turnaround is just a temporary aberration or a more lasting trend.
Detailed Analysis
#1 optimal accommodation choice: renting and buying are equally balanced options
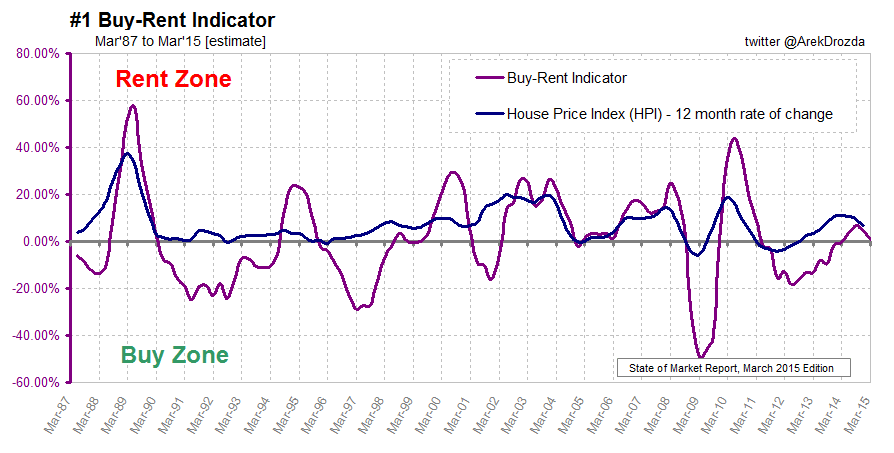
The Buy-Rent Indicator (BRI) identifies how cost of buying is changing in relation to cost of renting.
The latest estimate implies a substantial fall in BRI value, indicating that buying costs are now changing at a comparable pace to rental costs.
BRI is constructed based on the simple concept that renting and buying are substitute accommodation options; hence the optimal choice depends on which accommodation cost is rising in relation to the other.
The practical use of this indicator is for identifying market cycles and for timing purchase and sale decisions.
The reversal of the direction of the indicator is the result of the recent slowdown in growth of the national property prices as well as a reduction in mortgage rates. Both those factors contributed to the reduction in growth of purchasing costs which are now changing at the same pace as rental costs.
Cut in mortgage rates so late in the cycle, that is, after two years of rising property prices, is somehow unusual but it is not totally unprecedented.
The reset caused by RBA’s decision gave prospective buyers another opportunity to jump on the property ownership bandwagon.
Although this is not the most optimal time for buying (the optimal timing was at the bottom of the cycle in early 2012), nevertheless if interest rates are cut further and there is only a moderate growth in prices, the cost of buying will be rising slower than cost of renting, making purchasing a more attractive accommodation option. This scenario can be compared to the situation experienced in March 1999.
Only a very substantial rise in prices and/or interest rates can make buying unattractive again, as it happened in 2000.
#2 purchase affordability: at a historically high level and improving again
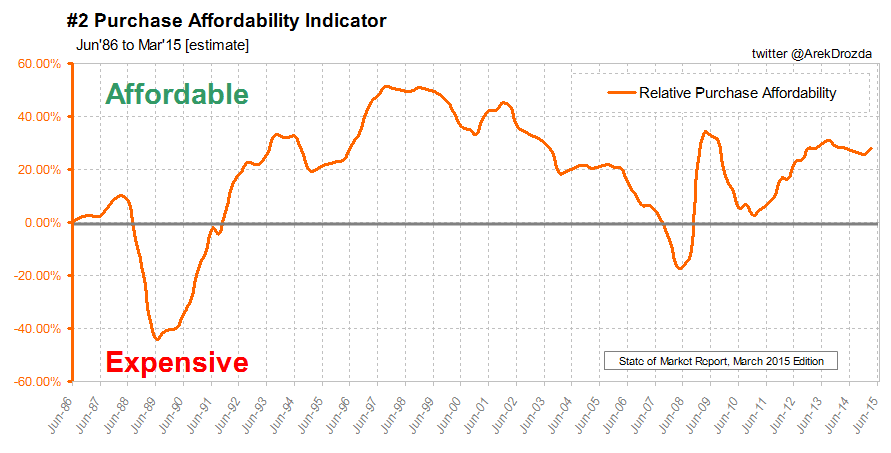
The Purchase Affordability Indicator (PAI) compares changes in the annual cost of buying to changes in average full time adult income; therefore, it identifies how purchase affordability has changed over time.
The March 2015 PAI estimate points to a reversal in the direction of the indicator, and hence, to improvement in purchase affordability.
This indicator explains that, in historical terms and relative to incomes of Australians working full time, property prices are still very affordable.
And thanks to RBA’s February decision on interest rates and continued, modest but steady, growth in incomes, the recent downward trend has been halted and purchase affordability is increasing again.
It may be hard to believe that after two years of price rises it can be the case but recent auction clearance rates leave no doubt how buyers feel about current prices.
Article continues on the next page. Please click below.
#3 perceptions about economy: still negative but no longer deteriorating
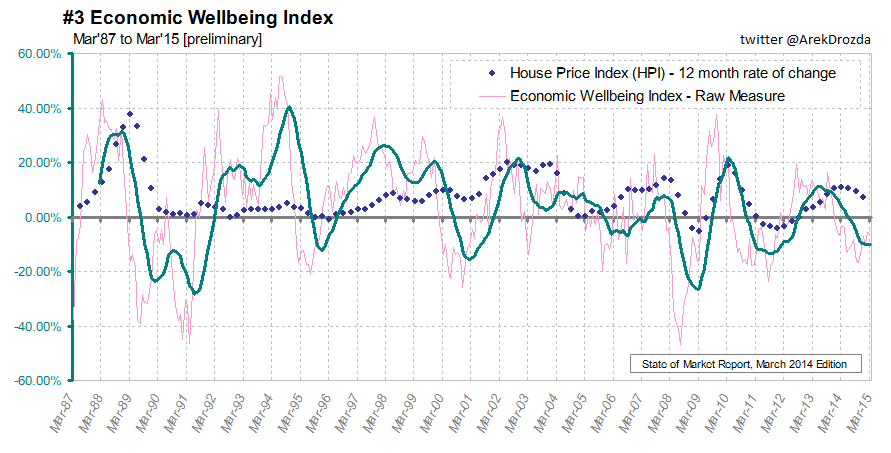
The Economic Wellbeing Index (EWI) is designed to reflect general perceptions of Australians about the current economic conditions.
The EWI has been falling since June 2013 but the trend is now levelling out. The raw measure recorded a small fall in March 2015 but it has been rising for the last few months.
The key premise behind this indicator is that people are generally less inclined to make big purchases when they are worried about the state of the economy.
The perceptions about the Australian economy, although still negative, are no longer deteriorating. And there are signs they are about to start reversing. However, the overall negative outlook for the economy is keeping the lid on the rate of growth of property prices. Without that restraint, chances are, we would be experiencing a rerun of early 2000’s. We all remember what happened then…
#4 demand: strong and expanding again
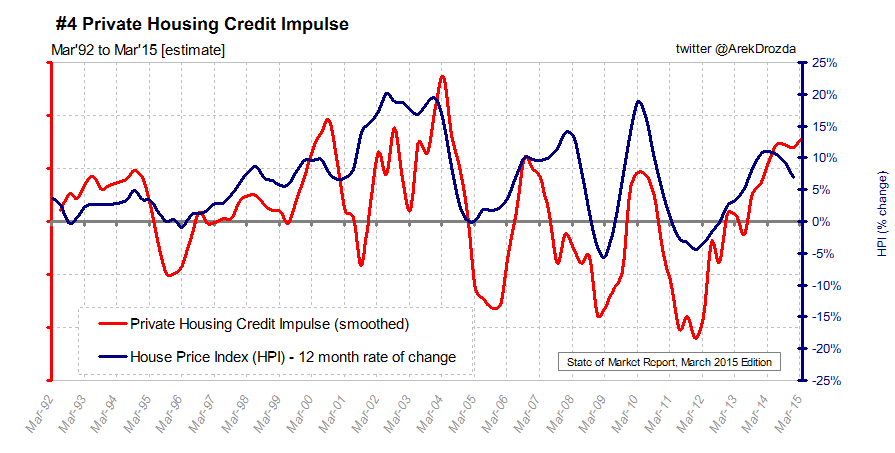
The Private Housing Credit Impulse (PHCI) provides an indication of the level of buyer activity in the residential property market in Australia, hence it reflects underlying demand for properties.
The March 2015 PHCI estimate reversed from falling to rising again, resuming the upward trend. PHCI is as its highest level since 2005, implying the highest rate of acceleration in housing credit in a decade.
The practical use of this indicator is to provide early warning about impending changes in housing credit uptake, and hence, changes in the underlying demand for residential property.
The March 2015 PHCI estimated value indicates a substantial rise in the underlying demand for the residential property in Australia. Hence, property prices have potentially much further to run in this cycle as the Australian public embraces the abundance of cheap credit. Perhaps, the scenario of a return of early 2000’s is not totally out of the question...
#5 property price expectation: growth very likely to continue at moderate pace
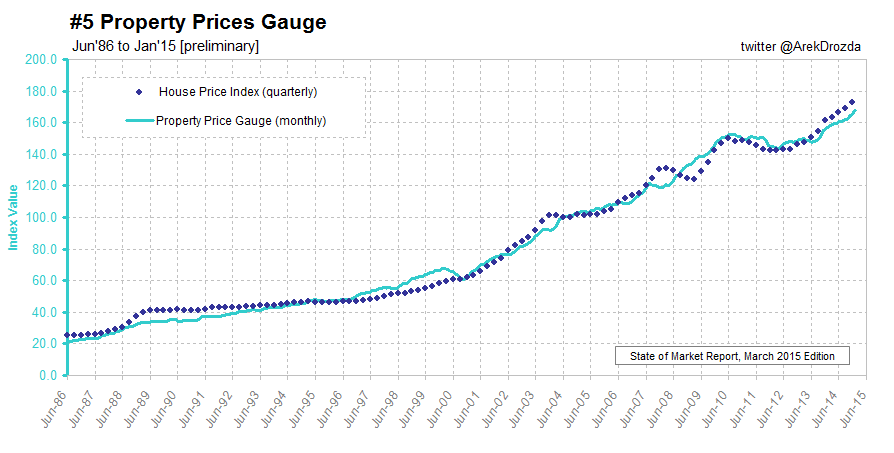
The Property Prices Gauge (PPG) is a proxy of a property price index. It becomes a leading indicator when combined with House Price Index (HPI).
PPG increased in January 2015 but the indicator continues to lag behind HPI.
The fourth in a row rise in the value of the PPG confirms the resumption of an upward trend of the indicator after several months of relatively flat results (that is, between March and September of 2014).
This gives the confidence that prices are reasonable and are well supported at current levels.
However, the gap between PPG and HPI is still large, and therefore, further price growth is expected to be kept in check (that is, at current growth levels or lower rate).
Arek Drozda is an independent property market analyst.
# Caveat - The information is provided in good faith and does not constitute financial advice. Use with caution and at own risk.
# Background information - For more extended description of individual measures and how to apply this information please refer to the first report in this series: State of the Property Market, April 2014.