
Further price growth likely, though pace may slow: May 2014 state of the market analysis

GUEST OBSERVATION
Summary
Market outlook: unchanged - positive with negative bias
- Buying and renting costs are changing at the same pace giving no preference to either option (as at March 2014).
- Purchase affordability is at a historically high level but the downward trend is now apparent (as at March 2014).
- Confidence in the economy has deteriorated further and is close to crossing into negative territory (as at May 2014).
- Housing credit is growing strongly, indicating healthy demand (as at March 2014).
- Actual prices are above of what could be expected based on housing credit growth but margin is reasonable (as at March 2014).
National Real Estate Price Forecast
Unchanged: conditions are supportive of further growth in prices in June 2014 quarter and beyond, however declining optimism about the economy indicates a possible slowdown in the pace of that growth.
#1 optimal accommodation choice: buying and renting costs are balanced
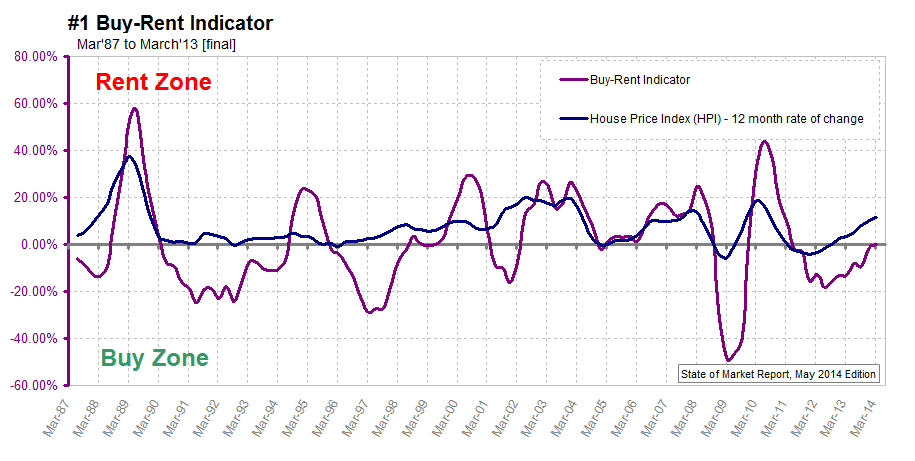
The Buy-Rent Indicator (BRI) identifies how cost of buying is changing in relation to cost of renting.
BRI bottomed in June ’12 (indicating the lowest point in the current cycle) and it has been rising consistently since then. The indicator has now reached the equilibrium line.
This indicator is constructed based on a simple concept that renting and buying are substitute accommodation options, hence the optimal choice depends on which cost is rising in relation to the other. The practical use of this indicator is for identifying market cycles and for timing purchase and sale decisions.
The crossing of the indicator from buy to rent zone gives a signal that buying costs are starting to rise faster than rental costs.
In the market where property prices are rising, this marks the point in time when opportunities to purchase a property at attractive prices may be all but exhausted in the current cycle. Prices are expected to continue on the upward trajectory from this point onwards which will cause buying costs to rise further.
#2 purchase affordability: at historically high level but declining
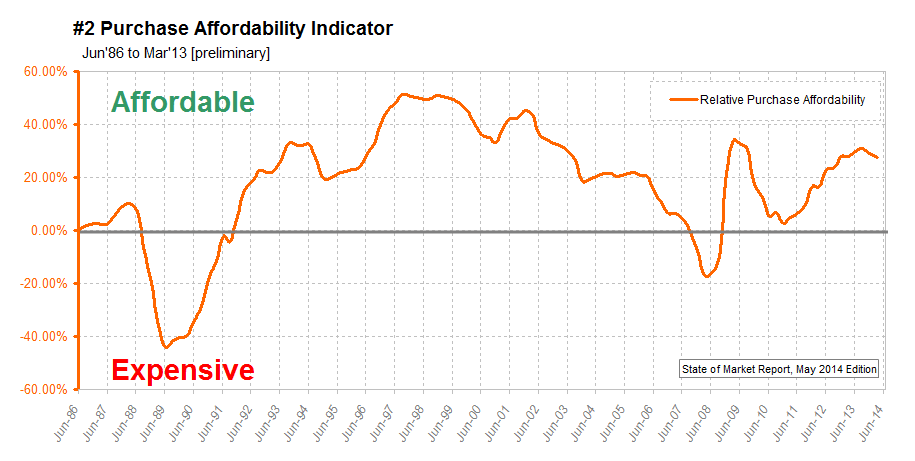
The Purchase Affordability Indicator (PAI) compares changes in the annual cost of buying to changes in average full time adult income, therefore it identifies how purchase affordability has changed over time.
PAI is at historically high level, comparable to that reached in 2009 or 1994, but is steadily declining from a peak reached in September 2013.
This indicator explains that, relative to incomes of Australians working full time, property prices are still very affordable. In the past 30 years purchase affordability was only better between September 1996 and December 2002.
Prices have still a lot of room to move before they can be considered unaffordable.
Article continues on next page. Please click below.
#3 perceptions about economy: conditions are deteriorating
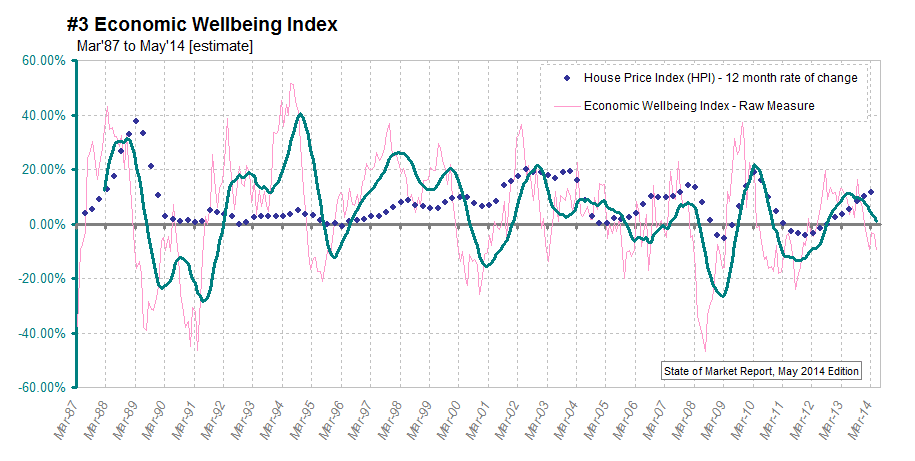
The Economic Wellbeing Index (EWI) is designed to reflect general perceptions of Australians about the current economic conditions.
The EWI is falling since June 2013 and has almost reached a crossover line.
The key premise behind this indicator is that people are generally less inclined to make big purchases when they are worried about the state of the economy.
EWI fallings towards neutral line indicates that perceptions of Australians about the state of economy are deteriorating but have not yet turned negative. Increased uncertainty about the economy can result in more sluggish demand for residential properties.
#4 demand: housing credit continue to grow
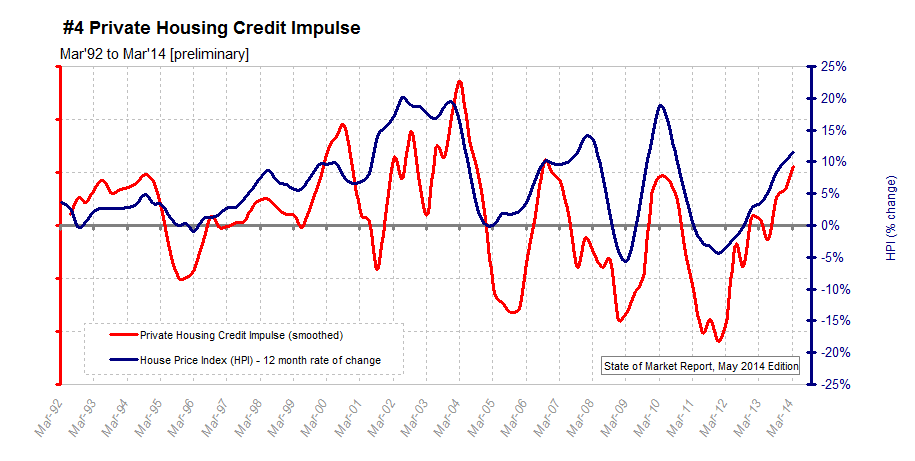
The Private Housing Credit Impulse (PHCI) provides an indication of the level of buyer activity in the residential property market in Australia, hence it reflects underlying demand for properties.
The preliminary March 2014 PHCI is positive and reached its highest value since December 2011. Consequently, property prices continue to record higher values.
The practical use of this indicator is to provide early warning about impending changes in housing credit uptake, and hence, changes in the underlying demand for residential property.
Positive and rising value of the indicator reflects continued strong demand for residential property.
#5 property price expectation: values are rising and are close to the level of actual prices
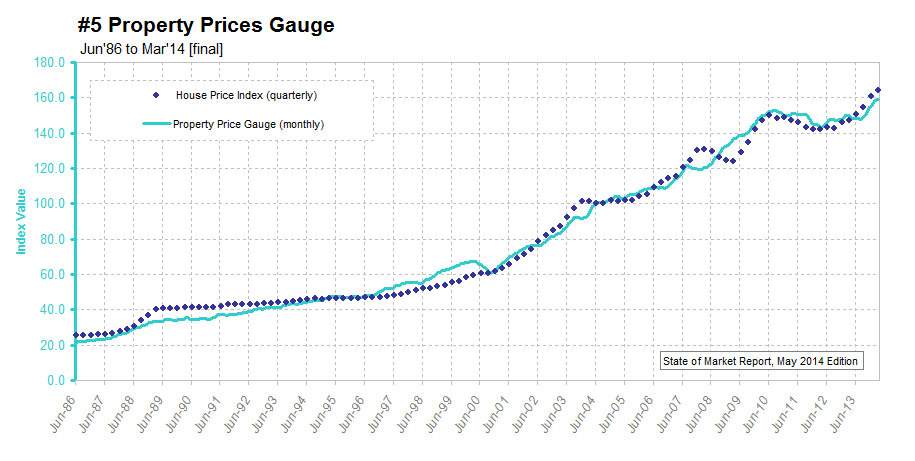
The Property Prices Gauge (PPG) is a proxy of a property price index. It becomes a leading indicator when combined with House Price Index (HPI).
PPG continues on the upward trajectory after a temporary slowdown between March and July 2013. The value of the indicator is close to the value of establish house price index.
Actual prices are above of what could be expected based on housing credit growth but not too far ahead. Therefore, current price level is well supported.
For more extended description of individual measures and how to apply this information please refer to the first report in this series: State of the Property Market, April 2014.
Caveat: The information is provided in good faith and does not constitute financial advice. Use with caution and at own risk.
AREK DROZDA is an independent analyst who has worked in the public and private sectors for over 20 years in business development, data analysis and in building geographic information systems.