
Buying more advantageous than renting, yet change imminent: April 2014 state of the market analysis

GUEST OBSERVATION
Residential property is considered an investment class and, as such, it is subject to market cycles where prices fluctuate over time.
Being aware of the stage of the market cycle can help in timing purchase and sale decisions.
However, it is rather difficult to gauge the state of the market and its future direction by examining only historical prices, even if these are reported on a daily basis - as is the case with RP Data's Home Value Index. Periods of rises and falls in prices are of different durations and subsequent movements can have very different magnitudes.
Frankly speaking, the dynamics of the Australian real estate market are very little understood despite its value exceeding more than threefold the capitalisation of all companies listed on the Australian Securities Exchange. Financial institutions are not investing in it directly hence long term research on performance and cycles is almost non-existent, or at least not available to the public.
True, we do have various, raw measures of price movement, reports on auction clearance rates, vacancy rates, intentions to buy, asking prices, or various affordability indexes but these were developed primarily in support of valuation or risk management activities of lenders and insurers, or for the purpose of economic modelling, and not necessarily to help in decision making by individuals. Besides, each of these measures on its own gives only a partial picture of the market.
Traders in shares, bonds, currencies and similar financial instruments have developed a myriad of secondary “technical indicators” to aid in recognition of prevailing market cycles and trends. There are no such indicators available for buyers and sellers of residential properties.
The only thing that comes close to a true market gauge is the concept of a “property clock” but it tends to be very subjective and readings often differ from one commentator to another. In other words, we are missing a truly analytical perspective on the state of the property market.
To address the lack of consistent, long term analytical measures that help understand the state of property market in Australia, I have compiled a set of unique indicators which I would like to share with you on a regular basis.
The aim of this first set of indicators is to provide a broad perspective on the national property market as a whole. Peculiarities of local markets will be assessed with another set of indicators which I intend to publish at a later date.
About the Indicators
The first two indicators in the set (buy-rent indicator and purchase affordability indicator) provide objective measures of relative attractiveness of residential real estate to prospective buyers. In other words, whether there is a potential incentive, “value” if you like, for prospective buyers to consider buying a property or not.
The third indicator, economic wellbeing indicator, reflects perceptions of Australians about the economy. Since people are more inclined to commit to a substantial purchase if they have a positive outlook on the economy, this indicator evaluates the likelihood of people committing to property purchases.
The fourth indicator, private housing credit impulse, measures what people are actually doing. That is, whether perceptions about the value of owning a property and outlook on the economy translate to actual purchases or not.
The fifth indicator, property prices gauge, aims to forecast how the collective actions of buyers will likely impact property prices and whether actual change in prices is proportionate to the volume of money flowing into the property market at any given time.
Actual prices feed back into the value proposition, as reflected in the first two indicators, which closes the information loop. This is the minimum set of indicators that allows drawing a definite conclusion on the overall state of the property market now and in the recent past.
The indicators are calculated back to mid 1980’s and where possible I publish them with a reference to the change in prices of established houses (as reported by the Australian Bureau of Statistics) to show how well they reflect the reality over time. I will provide my interpretation of the latest results, a bit more extensively than usual in this first edition, but please feel free to derive and share your own conclusions via comments.
A short explanation of some conventions to help in interpreting the information:
- Market outlook can be: positive, positive with negative bias, neutral with positive bias, neutral, neutral with negative bias, negative with positive bias and negative
- Charts are labelled as:
Estimate – if data estimates are used in calculations of the latest measure,
Preliminary – if mix of actual and estimated data is used to calculate the current measure, and
Final – where all inputs are actual data.
Caveat
The information is provided in good faith and does not constitute financial advice. Use with caution and at own risk.
Arek's April state of the market summary is on the following pages. Please click below.
Summary
Market outlook: positive with negative bias
- Current conditions favour purchasing over renting but change in trend is imminent (as at December 2013)
- Purchase affordability is at a historically high level and has most likely reached its peak (as at December 2013)
- Confidence in the economy has started to deteriorate in recent months but is still positive (as at March 2014)
- Housing credit is growing strongly, indicating healthy demand (as at March 2014)
- Actual prices are slightly ahead of what could be expected based on housing credit growth (as at February 2014)
National real estate price forecast
Conditions are supportive of further growth in prices in June 2014 quarter and beyond, however increasing pessimism about the economy indicates a possible slowdown in the pace of that growth.
#1 Optimal accommodation choice: Buying more advantageous than renting

The Buy-Rent Indicator (BRI) identifies how cost of buying is changing in relation to cost of renting.
BRI bottomed in June 2012 (indicating the lowest point in the current cycle) and it has been rising consistently since then. Although still in buy-territory, the indicator is fast approaching the equilibrium line.
This indicator is constructed based on a simple concept that renting and buying are substitute accommodation options, hence the optimal choice depends on which cost is rising in relation to the other.
BRI in “buy zone” implies that the cost of buying a property has either declined more or risen less, in percentage terms, than cost of renting, therefore making this accommodation option more attractive.
The practical use of this indicator is for identifying market cycles and for timing purchase and sale decisions. In particular, market cycles can be determined by identifying peaks or troughs on the graph (for example, the last two peaks were in March 2008 and June 2010 - and coincide with peaks in national property price indexes).
The crossing of the indicator from rent to buy zone gives a signal that costs of buying started to decline, or at least are rising less than costs of renting.
For those intending to buy in the current cycle the optimal point for making a purchase is when the indicator crosses into buy territory, if the decline is driven by falling interest rates. However, if the fall is caused primarily by falling prices the optimal point is when the indicator turns up, confirming that purchasing costs have bottomed in the current cycle.
The crossing of the indicator from buy to rent zone (which is now approaching) gives a signal that buying costs are rising faster than rental costs.
In the market where property prices are rising, this marks the point in time when opportunities to purchase a property at attractive prices may be all but exhausted in the current cycle. Prices are expected to continue on the upward trajectory from this point onwards which will cause buying costs to rise further.
For those intending to sell in the current cycle, the crossover marks the optimal point if costs of buying are rising due to changes in interest rates. If buying costs are rising primarily due to price increases, the optimal point for selling will be when the indicator peaks, which should coincide with a peak in property prices.
Please note, this indicator can be calculated only on a quarterly basis and is therefore lagging (the latest reading is for December 2013). That is, the confirmation of the cycle peak or trough can be delayed for up to six months.
#2 Purchase affordability: At historically high level, started to decline

The Purchase Affordability Indicator (PAI) compares changes in the annual cost of buying to changes in average full time adult income, therefore it identifies how purchase affordability has changed over time.
PAI is at historically high level, comparable to that reached in 2009 or 1994, but has recorded a decline in December 2013 from a peak reached in September 2013.
This indicator explains the reason why prices have been growing so strongly. That is, relative to incomes of Australians working full-time, property prices are still very affordable (in the past 30 years purchase affordability was only better between September 1996 and December 2002).
PAI is a lagging indicator and the latest available reading is for December 2013. This indicator will continue to decline if cost of buying grows faster than adult full time incomes. However, prices have still a lot of room to move before they reach an overpriced territory.
Article continues on next page. Please click below.
#3 Perceptions about economy: Outlook is positive but conditions are deteriorating

The Economic Wellbeing Index (EWI) is designed to reflect general perceptions of Australians about the current economic conditions.
The EWI is in positive territory but has been declining since June 2013.
A more volatile raw measure of the index is trending up again but only after it recorded significant falls in the previous four months and crossed over into the negative territory.
Declining EWI indicates that perception of Australians about the state of economy started to change to less upbeat since mid-2013 but overall, it is still positive.
The key premise behind this indicator is that people are generally less inclined to make big purchases when they are worried about the state of the economy. This has certainly been a pattern in the past – every time the index crossed into the negative territory, property prices either declined or reduced the rate of growth.
The index is still positive so there should be still plenty of positively thinking buyers and property prices are not likely to decline however, increased uncertainty should take some heat off the market.
The EWI is updated monthly and therefore it offers quite timely insight into the perceptions about the state of economy.
#4 Demand: Housing credit continue to grow
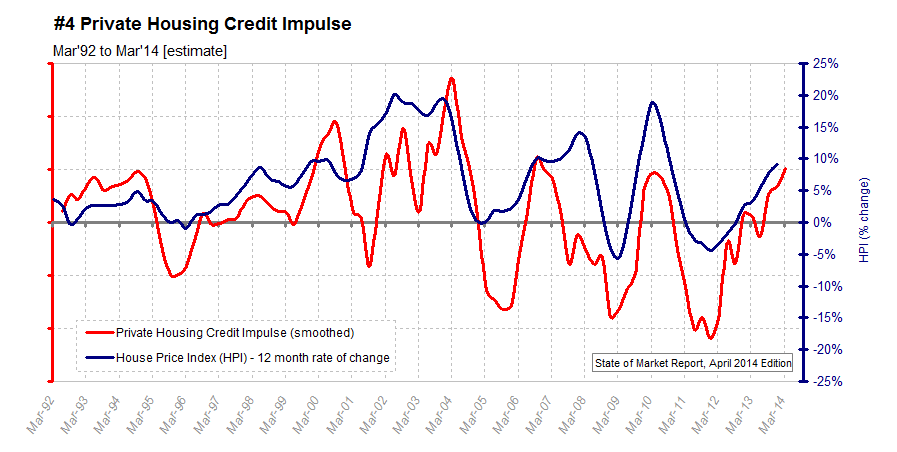
The Private Housing Credit Impulse (PHCI) provides an indication of the level of buyer activity in the residential property market in Australia, hence it reflects underlying demand for properties.
The March 2014 estimate is positive and reached its highest value since December 2011.
Positive and rising value of the indicator reflects continued strong demand for residential property.
The practical use of this indicator is to provide early warning about impending changes in housing credit uptake, and hence, changes in the underlying demand for residential property.
The most significant signals are when the indicator turns up after bottoming in the negative territory or when it turns down after peaking in a positive territory - since these indicate major trend reversal points.
PHCI bottomed in December 2011 when the decline in the rate of quarterly growth in mortgage finance reached the lowest level and started to improve (i.e. when mortgage finance started accelerating again). This trend was immediately reflected by the reduction in the rate of declines in property prices.
As more money started to flow into the property market, it coincided with a pick up in residential property prices from December 2012 onwards. The demand for property has been rising ever since, with a minor slowdown in June 2013 quarter.
The indicator is currently close to a level at which it turned down on two previous occasions - the September 2006 peak, after which credit declined significantly in a lead up to the Global Financial Crisis (which also coincided with a period of severe purchase unaffordability), and in June 2010 when property prices reached another peak, induced by post GFC stimulus.
In contrast to those previous occasions, property is now much more affordable than in 2006 and demand for residential property seems to be real (rather than induced with incentives, as in 2010), so there is a strong momentum for mortgage credit to continue to rise. However, there could be a temporary slowdown in the strength of that rise as a result of self-imposed credit restraints due to economic uncertainty.
It is important to note that, although this indicator is reported in quarterly intervals, it is derived on a monthly basis. In other words, it is initially calculated based on estimated values which are subject to subsequent revision once actual data becomes available. Hence, the latest quarterly reading can change from one month to the next.
#5 Property price expectation: Values are rising and are close to the level of actual prices

The Property Prices Gauge (PPG) is a proxy of a property price index. It becomes a leading indicator when combined with House Price Index (HPI).
PPG continues on the upward trajectory after a temporary slowdown between March and July 2013. The value of the indicator is close to the value of establish house price index.
Expected and actual prices are relatively close now, although were at variance for a while. This indicates that recent price rises are now in line with underlying demand and are not the result of a mad rush to buy.
PPG is calculated from credit related statistics and is not dependent on any reported property price data. It provides a good indication of the magnitude and future direction of the actual price movement.
The most significant signals from this indicator are when it diverges from actual prices - it points to either underlying strength or weakness of the market.
For example, it provided ample warning about 2008 price falls - almost a year in advance, and then signalled strength of a subsequent recovery. Post-June 2010, it provided evidence that the market was stronger than actual price falls indicated and again, signalled market recovery since March 2012.
The index is calculated on a monthly basis but house price data can only be updated in quarterly intervals.
You can read more of Arek Drozda's pieces here.
AREK DROZDA is an independent analyst who has worked in the public and private sectors for over 20 years in business development, data analysis and in building geographic information systems.