Pete WargentDecember 7, 2020
Let's face it, most property market commentary is at best reactive and at worst starts with the headline and works back through a smattering of evidence to support the preconceived conclusion.
Hence the large number of 2012 and 2013 articles which argued that in spite of falling interest rates Sydney, prices couldn't increase in this cycle since prices were already too high and that, it seemed, was that.
However, if you ignore one half of the equation - supply - in order to focus only on demand, the conclusions are always likely to be to some extent ill-informed.
Simply put, with appropriate housing supply in the city so weak for so long - almost an entire decade of unpropitious supply failure - low interest rates were destined to force upwards pressure onto the market and as prices ticked up the herd mentality followed.
Also in the simplest terms, developers needed prices to go up to justify building more stock, and while prices remained flat the dwelling shortage became more and more acute.
This is precisely why I confidently predicted the surge in prices.
Basic housing economics dictates that in a functioning market a material jump in dwelling prices combined with a lower cost of financing should result in a worthy supply response. And at last the data is starting to flow through which shows that we should now see a big uplift in Sydney dwelling construction.
Let's take a more in-depth look at the levels of supply due to come online and where it will be located.
Demand: population growth
In order to ascertain the adequacy or otherwise of supply, we first have to acknowledge the likely level of demand.
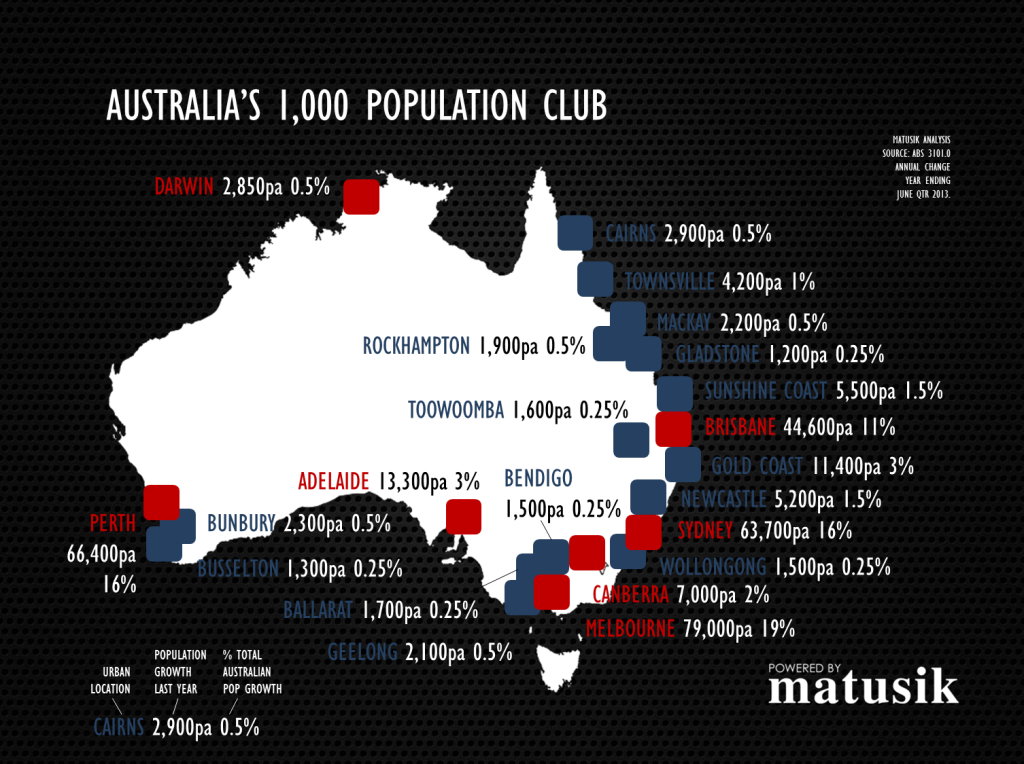
Australia's population is very heavily urbanised, with close to 40% of the population living in Sydney and
Melbourne.
The latest ABS population data showed that at the state level New South Wales has a population of 7.4 million people increasing by 102,200 persons per annum. Meanwhile, the the population of Sydney, depending on where you draw the boundaries, is around 4.6 million, and is growing at about 1.6% or 63,700 persons per annum as neatly charted in this
Matusik Missive.
Source: Matusik Missive
Demand: Sydney persons per household
After a century of declines, the number of people per household is now expected to stop falling.
Previous projections in 2008 saw the Sydney household size forecast to drop from 2.61 people per dwelling to 2.51 by 2031 (already well above the 2005 projections of 2.36 people per house by 2031).
Based on recent indicators it seems to be a fair assumption that the number of persons per dwelling will stop or already has stopped falling, in part due to affordability constraints in the harbour city.
If we take a figure of 2.6 persons per dwelling this implies that NSW needs around 40,000 dwellings per annum to house the expansion of the population and Sydney needs around 25,000 dwellings per annum.
When further allowances are made for obsolete stock and the need to address the currently existing ugly supply/demand imbalance
which I discussed in detail here, then it can be said that the city would want to see significantly higher completions in order to take the pressure of dwelling prices.
Previous estimations have ranged from around a required
27,500 dwellings per annum for Sydney through to 2031 up to
30,000 per annum. Given the chronic shortage of stock on the market, clearly the latter number would be far more effective in addressing the imbalance.
The rise of apartment stockIt is to be expected, with a rapidly growing city population in a constrained area such as Sydney, that more than ever before, the new dwellings will be of the apartment and medium-density type.
Sizeable uplift in building approvals in Sydney and NSWThe most recent data from the ABS showed
17,500 dwellings approved in the month for the whole of Australia, split between private sector houses (about 95,00) and other dwellings (about 7,800).
This is welcome news for the economy, and represents a huge annual uplift for private sectors houses (+26.4% year on year) and for other dwellings +46.3% year on year).
In NSW, the three month moving average monthly building approvals figure is now hitting at around 4,500 dwellings, which is a very solid figure.
And, more specifically, what for Greater Sydney? Well, we can certainly now see a huge uplift in building approvals particularly over the second half of 2013. The monthly data is necessarily volatile, but over the year to January 2014, there were 36,100 dwellings approved which is the highest level of approvals seen this century (since 1999).
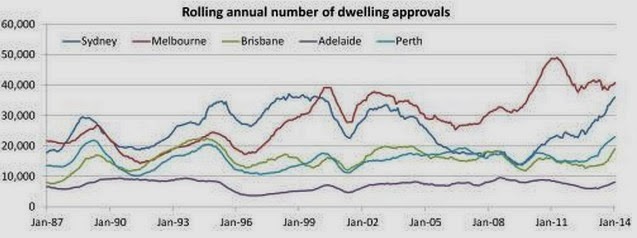
These numbers tend to make far more sense when put into a rolling annual number of approvals chart. Cameron Kusher chart of RP Data deserves a gold medal (or at least a cold beer) for slogging through the hard yakka below. Incidentally, just look at the rolling approvals figures for
Melbourne since 2008!
Source: RP Data
The chart shows Sydney's supply failure over the last decade.
Yet new apartment approvals in Sydney will now go on to eclipse their previous peak of 2003 when annual approvals hit 23,000.
BIS Shrapnel has forecast that Sydney will comfortably break new record for apartment approvals in 2014 and project that the figure will peak at around 25,000 in 2016.
Completion times
The Reserve Bank has highlighted its concerns about a possible lag between approvals and construction in a speech last year:
"...if average household sizes are no longer falling, the relationship between population growth and growth in the number of dwellings will change.
"And if I am right in expecting the share of high-density housing to increase, the dynamics of construction will also change.
"It takes longer to build a block of apartments on a brownfield site than the same number of dwellings as detached houses at the fringe. Dwelling investment has already become less cyclical in the past 10 years than it was in the previous 20 years.
"It might well be that construction lags – and concerns about supply – will become even more acute."
The ABS has presented its own data showing that completions are slower than they have been in times past.
 Source: ABS
Dwelling commencements
Of course dwelling approvals are not the same as dwelling commencements, but the most recent data has shown that dwelling commencements in NSW are finally starting to punch at around 10,000 per quarter and look set to head higher, and thus should begin to redress the supply imbalance in due course.
Conclusions
The data shows that dwelling commencements will begin ramp up quite sharply from now. Indeed, you can now witness this happening around the city with your own eyes.
The ABS average completion times suggest that over the next two to three years the apartment supply will really start to flow before reaching a peak around 2018-2019.
Naturally a greater supply of apartments introduces an elevated risk of a price correction in certain areas, which will be most heavily focussed upon a number of key sectors of the market.
In particular, buyers should take great care when
buying off the plan since such developments tend to demand a material newness premium.
When it comes to the risk of oversupply, it is crucial to consider substitutability and there are a number of higher risk areas which stand out as likely candidates.
I don't have space to list all the areas where I personally would and would not be comfortable buying but the central business district (and indeed other business districts in the city with few height restrictions on developments) tends to suffer from a perennial oversupply risk, as higher residential prices see more and more former office blocks being demolished to be replaced by apartment towers.
Stand by for a flood of media articles on this topic.
There will also be many thousands of new apartments located in certain inner suburbs where former industrial sites have now been rezoned.
These suburbs variously include Waterloo, Mascot, Zetland, Rosebery and Botany, among others. 25,000 new apartments are expected to be built in the inner south by 2018.
I note that a number of the new developments appear to consist of very small apartments, some of which look to be phenomenally expensive. Caveat emptor.
Conversely, there are a number of well-located leafy lifestyle suburbs where new supply has been almost completely capped over the past decade and these will continue to represent a far superior selection. Substitutability is significantly lower.
Buyers of apartments would likely do well to focus on those with a relatively high value value content in boutique blocks, rather than those in larger developments.
The Melbourne market in recent years appears to have experienced a period of overbuilding and oversupply in certain sectors (e.g. Docklands), resulting in significantly more stock on the market than Sydney and significantly higher than average vacancy rates.
Yet median prices in Melbourne are also seemingly defying all logic by continuing to grow at a phenomenal pace (+7% quarter on quarter) implying that buying the right property in the right location continues to be of vital importance.