
Glass half full or half empty? The latest property news is all about perspective
On the face of it, a time of predominantly positive data for the residential property markets, although much depends on whether you're a 'glass half empty' person, or of the 'glass half full' persuasion.
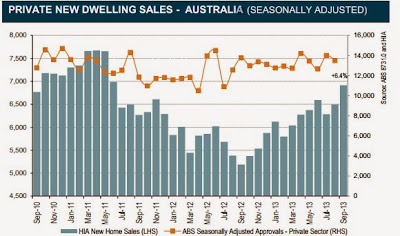
Source: HIA
Private new dwelling sales again jumped to send the data into a promising year-long uptrend, buoyed by low interest rates. The data from the Housing Industry Association showed sales of new homes at their highest level in over two years in the month of September.
As is almost always the case, if you dig deep enough it's easily possible to put a negative spin on the data, particularly if you drill down to the month on month figures by state which are inherently volatile. And we don't want to get dragged into the tired old "our economy is shrinking if you ignore the sectors that are growing" shtick.
The truth is that detached house sales are trending upwards strongly (+25% year on year) yet still remain below their long-term average in four out of the five states (Western Australia being the unsurprising exception), and thus there is still some heavy lifting for low interest rates to do. Sales of new multi-units remain largely flat year on year which is clearly a less than impressive statistic given the low interest rate environment.
Dwelling approvals
Moving on to Thursday's dwelling approvals data set which was more difficult to put a negative slant on, with unit and apartment approvals increasingly dramatically by 31.8% in the month, and, far more importantly, 31.9% over the year to September 2013. Approvals for houses also increased, although less dramatically by 7.7% year on year.
When it comes to Australian Bureau of Statistics (ABS) data, it pays not to become overly swayed by monthly spikes or anomalies (and approvals by their very nature must be a volatile data set), but the trend for total dwelling units approved is now clearly moving in the right direction. As noted, private sector housing approvals are also moving up, albeit at a slower pace.
Total dwelling units Private sector houses
Source: ABS
Taking a longer term view, total dwellings approved in Australia are once again trending upwards, driven largely by a big uplift in approvals for units and apartments since early 2009.
Total approved Houses approved
Units and apartments approved
Source: ABS
Naturally, fortunes vary by state, but the approvals trends for Western Australia and New South Wales (below) now look good since the trough of 2008/9. With a population growth of 3.4% per annum, Western Australia needs new dwellings, while within a quarter of a century there will be more persons in Greater Sydney than there are rivets in the Harbour Bridge (six million). Approval trends in other states remain less convincing.
NSW dwelling units approved WA dwelling units approved
Source: ABS
The value of new residential building increased in September by 2.3% and is also now in a clear uptrend.
Source: ABS
Economy
From a broader macroeconomic perspective, the data released last week poses some interesting questions, namely whether a pick up in residential construction (especially one which is leaning towards the construction of apartments rather than houses) can plug the hole in GDP which will be left as mining and engineering construction expenditure tails downwards. Estimates for total capital expenditure look set to slip through 2013-14 and beyond, after a booming decade.
Source: ABS
The relative size of the dollar numbers in the previous two charts above tell one very clear story: it's going to take more than just an upturn in residential property construction to see stronger economic growth returning should mining and other capex drop sharply.
In this context, it was heartening to see a second consecutive month of growth in AIG's manufacturing index for September, and David Jones (DJS) saw a long overdue 6.6% bounce in its share price on Friday after at last recording a bounce in its Q1 2014 sales. We may even see a post-election bounce in business confidence, although it's clearly far too early to be engaging in any back-slapping yet.
Dwelling prices
RP Data released its property price data for the month of October, recording yet another blinding month for Sydney (median prices up by a further 2.4% in the month, taking quarterly gains to 5.5% and year-to-date gains to almost 13%) but a horror quarter for Hobart where median dwelling prices were recorded as having fallen by some 6.0%.
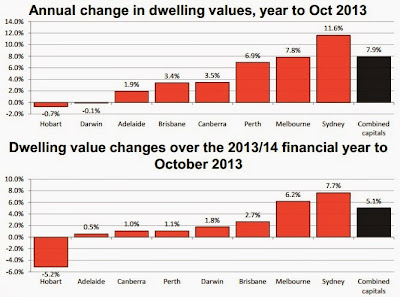
Source: RP Data
As I've emphasised previously, this property market recovery was always likely to be Sydney-centric in nature - largely thanks to the city's relatively weak price performance since its preceding boom through to early 2004 - although there are signs of a moderate upturn in some other areas.
Median dwelling prices are now up since their respective troughs in all of the major capital cities according to RP Data, with Sydney (+16%), Melbourne (+12%) and Perth (+10%) remaining some way ahead of the laggards Brisbane (+4%) and Adelaide (with less than 4% growth).
Interest rates
I've heard the arguments both for cuts in the cash rate (to boost ex-Sydney residential property prices plus the wider state economies) and for tightening monetary policy (seems perhaps unlikely to me until there is some clear evidence of unemployment trending downwards and maybe further data on the likely impact of the so-termed 'mining cliff').
Hang onto your hats, however, because earlier in the week the largest provider of mortgage broking services in the country, Australian Finance Group (AFG), publicly released its mortgage index data for October showing that it processed more than $4 billion of home loans in the month. This represents another huge monthly increase of more than 12% from $3,624 million in September and a colossal increase of more than 61% from its October 2011 figure ($2,509 million).
Even allowing for subtle shifts over time in AFG's relative market share, the monthly index figures tend to represent something of a reasonable belllwether for housing market sentiment, and the official cash rate down at 2.50% is clearly now dragging investors and home buyers back into the market.
Is Australian housing getting cheaper?
Clearly, the property markets are on the move again. In fact, according to RP Data, they have been since around May 2012, as low interest rates have brought buyers back into the fold.
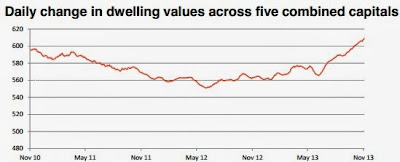
Source: RP Data
The low interest rates have also brought a welcome affordability dividend for homeowners, with mortgage repayments becoming very significantly cheaper in recent years. But have the property markets become any more affordable since their peaks in terms of capital cost?
RP Data's Cameron Kusher prepared the below inflation-adjusted chart which shows that the answer is clearly "yes", but only in certain parts of the country. Notably, Brisbane and Hobart remain significantly more affordable city housing markets than they were at their respective previous peaks.
Prices in Sydney, however, are moving sharply upwards and thus affordability is declining, particularly in hot sectors of the market such as the inner west. Australian Property Monitors noted that the harbour city's inner west suburbs recorded another "sizzling" 86% auction clearance rate at the weekend.
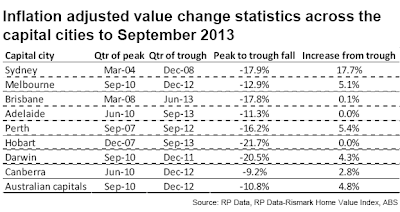
Source: RP Data
The Reserve Bank (RBA) has gone to quite some lengths is recent years to emphasise its belief that while the capital cost of housing is comparatively expensive in Australia, affordability of mortgages is better than it was in the era of higher interest rates two decades ago.
If I was a betting man I'd have a flutter on the cash rate staying right where it is for quite some time to come yet. The futures markets are onto this and have priced out all further rate cuts (albeit with a moderately inverted implied yield curve) while three year fixed rate mortgages have ticked up in the past week. A rate hike is priced in for early 2015, although your guess is as good as mine when it comes to predicting the future.
Pete Wargent is the co-founder of AllenWargent property buyers (London, Sydney) and a best-selling author and blogger.
His new book 'Four Green Houses and a Red Hotel' is out now.