
Deciphering the RBA mindset as it paves the way for steadier dwelling price growth in 2013: Pete Wargent
The Reserve Bank is certainly going to town on its housing market speeches at the moment, as I previously noted here. This week, the head of Financial Stability, Luci Ellis, gave a speech in Sydney, they key themes of which I summarise below.
Make no mistake, when the RBA prepares charts it does so with an underlying message in mind. Let's see what we can decipher.
Firstly, Australia is no longer the high-inflation country that it was in the 1970s and 1980s, but note how house prices did continue to rise even as inflation slowed.
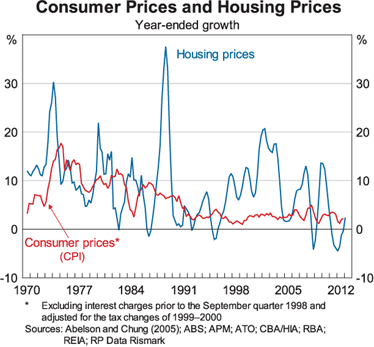
Why? Because inflation acts as a 'credit constraint'. In other words, interest rates include an inflation compensation component. So, as inflation fell, so did the inflation compensation component of mortgage rates.
Therefore, estimates the RBA, due to lower inflation, we might expect the borrowing ratio roughly to have doubled as measured against income multiples.
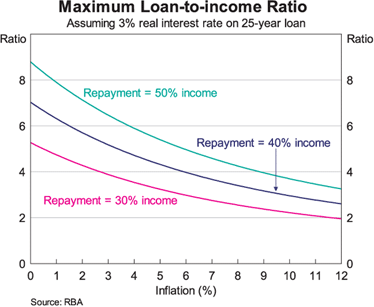
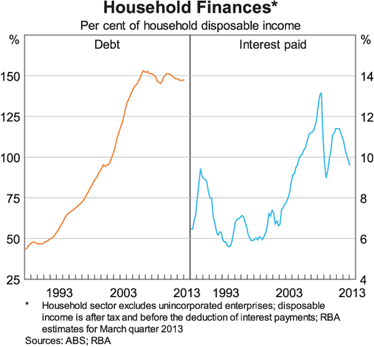
Says the RBA, they would have expected household debt to rise. And it has. However, the transition period ended way back in 2005. Since then, the debt-income ratio flattened, in their own words, "to a new, higher average"...
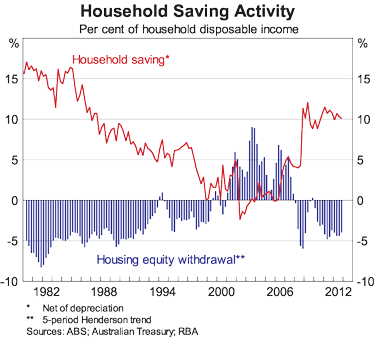
And, in recent years, households have begun to save again.
Expect on average national future dwelling price growth and credit growth to be slower in the future, says the RBA.
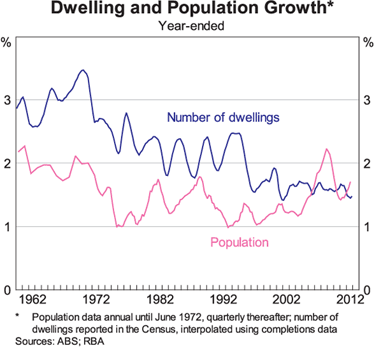
The population continues to boom, by around 380,000 persons per annum at the current rate of expansion, and the number of persons per dwelling has fallen dramatically over the decades. Therefore we need tens of thousands of new dwellings each year to house the rapidly growing population.
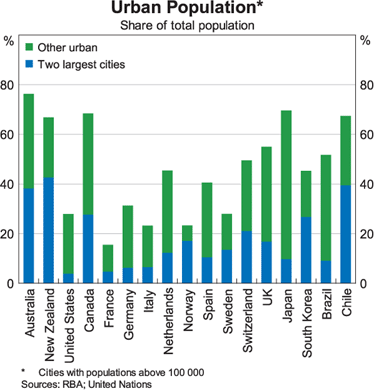
The urban population of Australia is massively focussed on the two largest cities, with nearly 40% of us living in those two metropolises. We have a lot of land, but most people only want to live in a very small part of it: the "acceptable range of locations is limited."
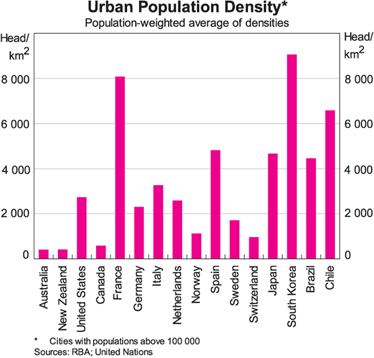
Why the problems with constraints on supply? Largely, because individually we use so darned much of the desirable land. We live on enormous plots and have the least dense population of any country with cities of a comparable size. Only NZ is anywhere remotely close to Australia in this regard.
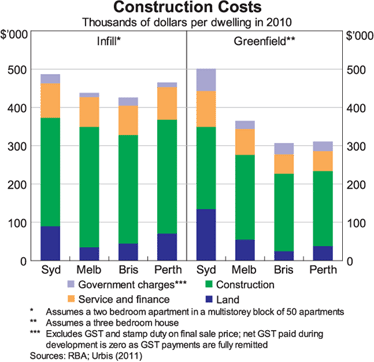
Land cost isn't the real problem, says the RBA, and it isn't government charges either, which make up a small component of property prices.
It's overwhelmingly the construction costs of our shiny new dwellings that makes new property an increasingly expensive proposition.
Key quote:
"...the price of our low-density life has become unaffordable for some.
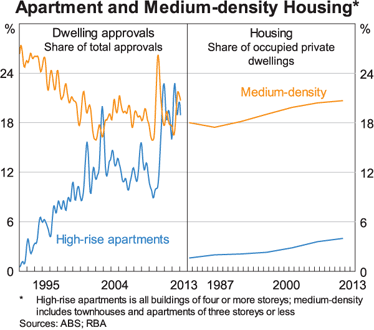
It therefore seems likely that our cities will become denser over time.
If so, the mix of residential construction will be tilted more towards medium-density and high-density dwellings than in past decades."
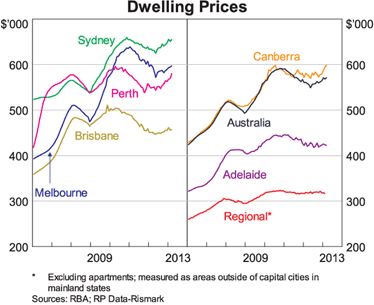
Prices are rising in some cities, notably Sydney and Perth. Flat for many years now in others such as Brisbane and Adelaide, and also very little house price growth in regional Australia.
I noted that the RBA prepares charts with a message behind them. We have seen the below chart before, intended to demonstrate that with lower interest rates, repayments on new housing loans aren't nearly as high as a percentage of household disposable income as the popular consensus would have you believe.
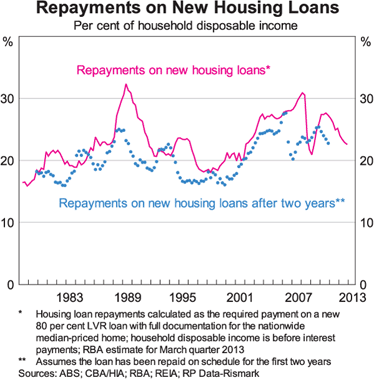
Note how the RBA has added a second (blue) line now. The message being delivered here: not only are repayments now more affordable on new housing loans they are also considerably cheaper on existing housing loans.
The underlying point, with interest rates set to fall even further, appears to be: "Stop complaining about property prices, because your repayments are lower."
As noted above, we'll have more higher-density dwellings in the future, and fewer detached houses:
But, the RBA highlights that it takes longer to build a block of apartments than it does houses in fringe suburbs.
The undersupply is set to become a major problem in some urban areas: "It might well be that construction lags – and concerns about supply – will become even more acute."
It's a worrying trend of appropriate supply failing to meet demand, certainly in my part of the world (Sydney).
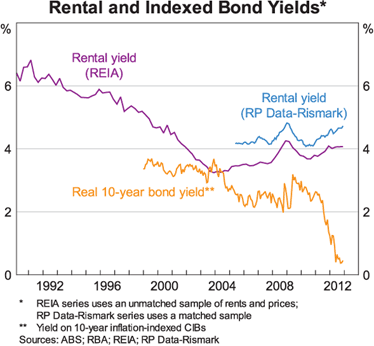
Rental yields have been rising. Bond yields have been smoked.
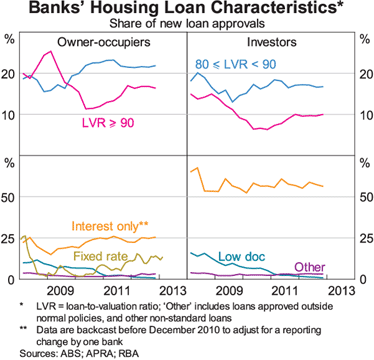
Lending standards have become much tougher - fewer low-doc loans, for example. This is good for market stability.
Summary: on average price growth and credit growth will be slower than we have seen in the past, but I am expecting the construction lag to cause a major undersupply of desirable dwellings in inner- and middle-ring Sydney suburbs and some other supply-constrained regions.
A further cut in interest rates on June 4 or perhaps a little later in 2013 may see median dwelling prices markedly higher by 2014 and payments on new housing loans revert upwards.
Pete Wargent holds a range of finance and property qualifications and is the author of Get a Financial Grip – a simple plan for financial freedom.