
Biggest lift in planned investment in 7 years: Craig James

GUEST OBSERVER
Businesses are investing again.
And while ‘animal spirits’ are not running rampant as yet, the best back-to-back gains in investment spending have been recorded for three years. And the outlook is brightening.
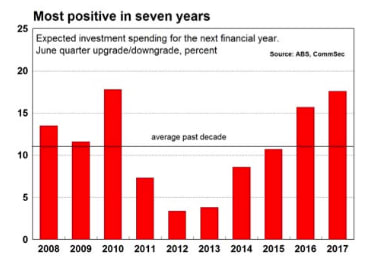
In the June quarter, expectations for investment in 2017/18 lifted by almost 18 per cent. You have to go back seven years to find a June quarter upgrade as positive.
Investment outside mining and manufacturing sectors hit record highs in the June quarter. And this may be under- stating the true situation because the Bureau of Statistics survey of investment excludes a number of key sectors such as health care, education, the public sector and agriculture.
So overall there is a lot to like with the latest investment survey – spending is rising, especially in the services sectors, while investment plans are being revised higher. Lower prices for equipment is one of the factors supporting investment spending together with strong corporate balance sheets.
What do the figures show?
Private business investment
Overall: Business investment (spending on buildings and equipment) rose by 0.8 per cent in the June quarter after a 0.9 per cent lift in the March quarter. Spending on buildings fell by 0.6 per cent in the quarter while spending on equipment rose by 2.7 per cent – the strongest quarterly gain in almost three years. Investment is down 3.0 per cent over the year with buildings down by 5.1 per cent while equipment was down by 0.1 per cent.
Sectors: Mining investment fell by 2.8 per cent in the June quarter, while manufacturing spending rose by 1.4 per cent and spending by “other selected industries” rose by 2.8 per cent.
States: In seasonally adjusted terms investment rose in five of the eight states and territories in the June quarter: NSW (up 3.5 per cent); Victoria (up 2.5 per cent); Queensland (up 1.6 per cent); South Australia (down 5.5 per cent0; Western Australia (down 1.4 per cent); Tasmania (up 0.4 per cent); Northern Territory (down 7.3 per cent; ACT (up 9.2 per cent).
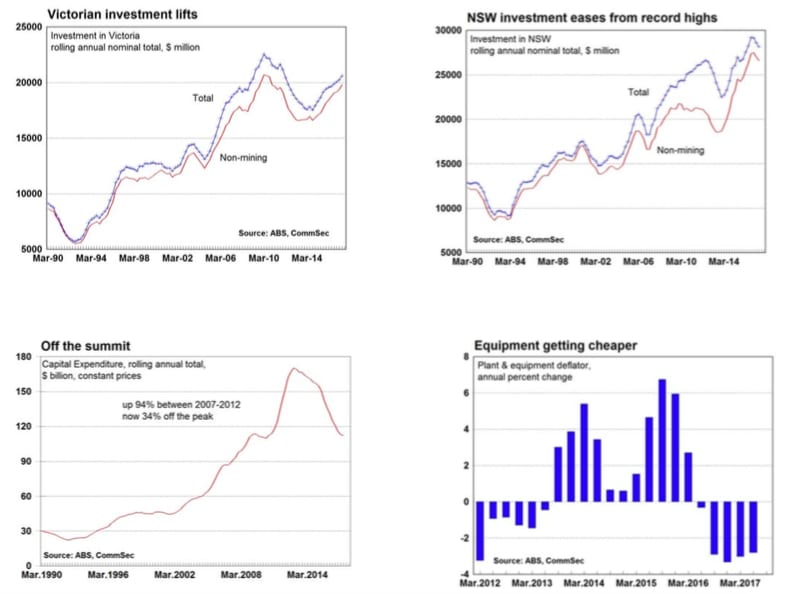
Prices: The overall deflator for investment goods rose by 0.1 per cent in the June quarter after rising by 0.2 per cent in the March quarter. The cost of buildings and structures rose by 0.7 per cent while the cost of equipment fell by 0.5 per cent. Over the year, the cost of investment goods rose by 0.5 per cent. The cost of buildings rose by 3.1 per cent – the fastest rate in 8 years – while the cost of investment equipment fell by 2.8 per cent.
In 2016/17, business investment totalled $112.2 billion – the lowest financial year total in seven years.
Forecasts: The third estimate of investment in 2017/18 is $101.78 billion and is 3.6 per cent lower than the third estimate for 2016/17 – the smallest decline (best result) for a second estimate reading in five years. The upgrade in investment between the second and the third estimate was 17.6 per cent – the biggest upgrade in 7 years.
Private sector credit
Private sector credit (lending) rose by 0.5 per cent in July after a 0.4 per cent rise in June. Annual credit growth eased from 5.4 per cent to 5.3 per cent.
Housing credit grew by 0.5 per cent in July to be up 6.6 per cent on a year ago. Annual growth was steady at 6.6 per cent.
Owner occupier housing credit rose by 0.5 per cent in July to stand 6.1 per cent higher over the year. The last time growth was lower than now was September 2015. Investor housing finance lifted 0.4 per cent in June to stand 7.4 per cent higher over the year – the third month annual growth has been at that level.
Personal credit fell by 0.1 per cent in July to be down 1.4 per cent over the year.
Business credit rose by 0.5 per cent in July after a 0.8 per cent rise in June. Business credit is 4.2 per cent higher than a year ago.
Both M3 and Broad Money fell by 0.1 per cent in July – the first declines in six years.
What is the importance of the economic data?
“Private New Capital Expenditure and Expected Expenditure” is released quarterly by the Bureau of Statistics. The figures show both actual and expected spending by businesses on tangible assets such as new buildings, machinery and office equipment. The figures are obtained after sampling 8,000 private business units.
Private sector credit figures are released by the Reserve Bank on the last working day of the month. Credit is separated into three categories – housing, other personal and business. Private sector credit is effectively the amount of loans outstanding in the economy. If growth in lending is strong then it suggests that credit from financial institutions is freely available, underlying demand for assets such as cars and houses is firm and that the price of credit (interest rates) is attractive.
What are the implications for interest rates and investors?
Businesses are confident and spending. And the expectation is that businesses will keep spending. In fact during the earnings season a number of listed companies indicated a preference to plough money back into their operations rather than just continue to lift dividends.
Despite the positive data, CommSec still expects official interest rates to remain on hold for an extended period. Investment is lifting, but from a low base. And inflation is contained outside the construction sector.
Craig James is the chief economist at CommSec.

