
Has the Australian labour market turned a corner? Gareth Aird

GUEST OBSERVER
The labour market has comprehensively strengthened over the past four months.
Trends in employment (including the composition of jobs growth), the unemployment rate, participation and hours worked suggest that output growth will accelerate over H2 2017.
Sustained strength in the labour market is a necessary condition for wage inflation to lift.
Overview
After a soft 2016 the Australian labour market is on an encouraging trend. The latest ABS employment report was the fourth robust set of monthly jobs numbers in a row. The improvement is evident in a range of labour market indicators. And it suggests that GDP growth will lift over H2 2017. As a result, market pricing for another rate cut has faded to zero and a 65% chance of a hike within the next twelve months is now priced.
In this note we analyse the latest trends in the key metrics that relate to the labour market. We also take a brief look at outcomes by state. We conclude by presenting our views on what we think is in store for the labour market over the second half of 2017 and what it means for policy.
Employment
We kick off with employment growth because job creation goes hand in hand with output growth (chart 1).
Click to enlarge

Over the past four months there’s been a marked improvement in jobs growth. The ABS reports that employment has lifted by 154k over the four months to June and the average monthly gain has been 38.5k (chart 2). These results are strong. As a result, annual employment growth in the year to June 2017 accelerated to 2.0% - quite a bit higher than population growth (1.5%pa).
As we flagged a few weeks ago, Australia’s population growth has boosted headline growth rates and masked some per capita weakness in the economy. But if employment growth can continue to outpace population growth some of the per capita metrics related to the labour market and output will improve. From GDP perspective, the recent trend in jobs growth means we should see a lift in growth over H2 2017 after a soft 2016/17.

In addition to strong employment growth, the composition of jobs growth has been impressive. Taken at face value, full-time jobs have lifted by 179k over the past four months while part-time employment has fallen by 25k. As a result, the annual growth rates have converged (chart 3).
There can be a fair bit of noise in the PT/FT split each month. But looking at the trend series indicates there has 4.0 recently been a solid lift in full-time jobs growth.
This is a welcome development and is reflective of some genuine strength in job creation. In addition, the pace of full-time job losses from the fall in mining-related employment has eased which means that the headwind on net full-time jobs growth has lessened.
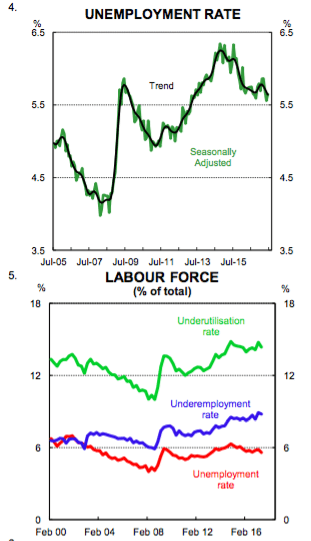
2. Unemployment
There has been a modest improvement in the unemployment rate in recent month which reflects the combination of solid jobs growth dampened a little by a lift in participation. The trend unemployment rate, our preferred measure of the jobless rate, has come down by 0.2ppts over the past four months to be 5.6% in June (chart 4). The current level of the unemployment rate is not at a historically high
one. But despite the fall it is above the non-accelerating inflation rate of unemployment (NAIRU) which the RBA recently estimated to be 5%. It suggests that there is still a fair way to go to take the economy back to the level we associate with full employment. But it’s moving in the right direction, albeit that it’s a slow grind.
Job security fears have remained stubbornly high despite the recent improvement in the labour market. It looks to us like the latest strength will need to be maintained if job security fears are to lessen. In fact, in may be the case that a lift in wages growth is also required for job security fears to recede.
3. Underemployment and underutilisation
Underemployment remains a problem in Australia. In May, the underemployment rate was 8.8% - just 0.1ppt off its record high (chart 5). To recap, people who are underemployed have a job but want to work more and can’t find the work.
The number of additional hours of work wanted by underemployed workers has been stable at around two days (or 14hrs) per week since the mid-2000s. This compares with unemployed people who are on average looking for 33 hours of work per week.
On Wednesday, when this note was in train, RBA Governor Philip Lowe gave a speech on The Labour Market and Monetary Policy which covered a lot of the themes here. One chart in the Governor’s speech depicted proportionately the reasons why people work part-time. The data came from the HILDA release and indicated that the bulk of people in part-time work have chosen to be there. Nothing surprising there. Interestingly, however, the proportion of people who are working part-time because they could not find full-time work was put at around 9% which marries up almost perfectly with the underemployment rate.
Data on underemployment is published by the ABS on a quarterly basis so we will need to wait until August for the next update. But the trend lift in full-time employment suggests that it’s more likely than not that the underemployment rate inches a little lower when the new data prints.
The sum of the unemployment rate and the underemployment rate produces the underutilisation rate which is the broadest measure of spare capacity in the labour market – using the latest unemployment and underemployment rates puts it at 14.4% in June. This is quite high and means that the economy is operating below its capacity and there is a negative output gap. We have known this for some time. What we are interested in from here is the direction in the underutilisation rate and there are tentative signs that it’s starting to decline. In our view, it’s going to need to come down materially to generate wages inflation.
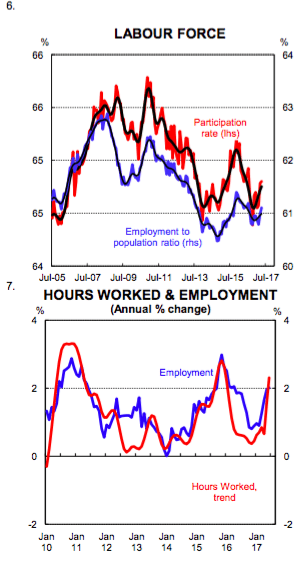
4. Employment to population and participation
The share of the Australian workforce in a job has recently lifted. The employment to population ratio has ticked up by 0.46ppts to 61.3% (chart 6). This shift upwards basically reflects employment growth running above population growth. Given the very solid jobs growth over the past few months we would have expected the unemployment rate to fall by more than 0.2ppts. But its decline was capped due to a lift in participation.
Labour force participation has picked since late 2016. There are structural and cyclical forces that drive participation and it looks like some of the cyclical headwinds have receded. At the end of 2016 the part. rates of WA and Qld had fallen quite a bit through the year as the big downturn in mining-related investment reduced job prospects for workers in these states. As a result, some local workers had given up looking for work which reflects the discouraged worker syndrome. But the recent lift in jobs in WA and Qld has been coupled with an increase in participation which suggests a touch more optimism for workers in these states.
5. Hours worked
Hours worked, as you would expect, is strongly correlated with output, consumption and employment growth. It is also a key input into examining productivity growth because we can measure output per hour (or unit of labour).
Monthly aggregate hours worked is quiet volatile so we look to the annual change in trend terms to best gauge what’s been happening in that space (chart 7). The news is pretty decent. The data indicates that growth in total hours worked has accelerated to be 2.3% higher in the year to June 2017. For most of the last five years annual employment growth has been stronger than growth in hours worked because of the strong growth in part-time relative to full-time employment. But the recent strong lift in full-time employment has seen growth in hours worked pick up to be running ahead of employment growth. It’s still early days and we aren’t getting too carried away. But these type of developments are generally commensurate with an authentic lift in the demand for labour.
The increase in aggregate hours worked has been sufficient to see per capita hours worked lift from a multi-decade low (chart 8).

Again, we are coming off a low base and there will need to be a sustained upward trend in per capita hours worked if Australia’s labour market is going to genuinely tighten.
6. Labour market by state
In our view, one of the striking things about the latest jobs growth is that it’s been relatively broad-based (charts 9 and 10). For most of the past few years there has been a “two-speed” economy that comprises i) NSW and Victoria (driven largely by Sydney and Melbourne); and (ii) the rest of Australia. We wrote about this in late 2016.

But the labour force data suggests that we may be seeing some convergence in outcomes. This is a particularly welcome development.
Jobs growth has been spectacularly strong in Victoria, driven by population growth. But there has also been solid growth in employment over the past few months in Qld, WA and SA, which had previously all looked soft. Employment growth in NSW has slowed, but that’s to be expected given Australia’s biggest state is close to full employment.
There is a little more divergence in terms of trends in the unemployment rate (chart 11). The trend jobless rate in NSW sits at a healthy 4.8%. In Victoria, despite strong employment growth, the unemployment rate has remained stuck above the national rate at around 6.0%. The jobless rate has also trended sideways in Qld while it’s unexpectedly fallen in WA.
What does it mean for policy?
There are two key questions that need to be answered to determine what the recent labour market trends mean for monetary policy: (i) can they be maintained; and (ii) will they generate wages inflation.
On the former, the leading indicators suggests that the pace of job creation will ease from its current red-hot pace. But it should still be sufficient to match and slightly better the monthly increase in labour market supply (charts 12, 13 and 12. 14). The CBA PMIs, along with the NAB Business Survey and the vacancies data, suggest that employment growth should average around 20k a month in the near term. That would be enough to exert some further mild downward pressure on the unemployment rate.

There are still plenty of headwinds for the labour market to contend with over 2017. Namely, a gradual decline in dwelling construction, closure of the car industry and the completion of the final big resources projects. But there are also a few tailwinds at work like the continual ramp up in public investment, particularly in NSW, and the improvement in the global economy which is providing a boost to Australia’s tradables sector.
On that basis, the first condition about ongoing labour market improvement is satisfied in our view and that takes another rate cut off the table. The focus therefore shifts to what the improvement in the labour market means for wages growth given a lift will be required to propel core inflation back to target. Here, we think that we are still some way from labour market slack being eroded sufficiently to put genuine upward pressure on wages.

Our modified Philips curve, which puts underutilisation against wages growth, suggests that we probably need to see underutilisation fall comfortably below 14% for wages growth to lift (chart 15). In our view, that is unlikely to happen until early next year which would all but rule out a rate increase in 2017. In addition, because any improvement in wages growth is coming off a very low rate, we suspect that the RBA will not act to tighten until a solid uptrend is firmly in place. As a result, we don’t see the RBA raising rates until late 2018.
Gareth Aird is economist at Commonwealth Bank and can be contacted here.

