
How worrisome is Australia’s high household debt? Paul Bloxham

GUEST OBSERVER
Australia’s household debt has been rising and is high by international standards.
The household debt-to-income ratio has risen from 167 percent in 2011 to 190 percent in Q4 2016. Assessing how much to worry about this is not straightforward.
On the one hand, high levels of debt make the economy more vulnerable to a negative economic shock. On the other hand, appropriately allocated debt is an engine of economic growth, as it better allocates resources between savers and investors.
Our long held view is that high household debt is not, in itself, a problem, as long as it is held by households that can continue to service it. The problem faced by many economies during the global financial crisis, such as the US and Spain, was that household debt was misallocated to households that could not service it. In Australia, the latest available statistics suggest that the distribution is fairly favourable.
As at 2014, most of the debt was held by high income earners and there were few low income households with large debt servicing burdens. In addition, Australia does not have sub-prime borrowers and all of the mortgages are full recourse.
However, household debt has risen since 2014 and there has been an investor-led house price boom in Sydney and Melbourne. As a result, it is hard to be certain about how much risk has built up recently. The longer it goes on, the more difficult it is to judge. It is for this reason that prudential settings have been tightened and that RBA Governor, Mr. Phil Lowe, has repeated that it would not be in the ‘public interest’ to cut interest rates further if it provided another boost to housing prices and debt.
In its recent financial stability review, the RBA deemed that, given lending standards have been tightening, the key risk from rising household debt is to the macroeconomic cycle rather than financial stability.
The central bank’s own granular assessment is that any build-up of risks that could see rising defaults in a downturn is not large enough to be a financial-system-wide risk. Rather, they suggest the key risk is that the higher household leverage could amplify the economic cycle. We expect that concerns about high and rising household debt will be a key factor that keeps the RBA from cutting its cash rate further. We expect prudential settings to remain tight.
Household debt is high, but mostly for fundamental reasons
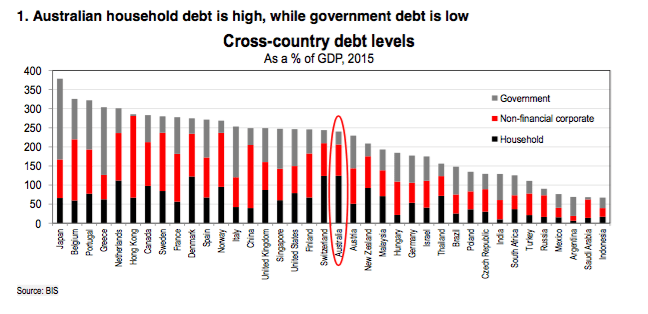
Australia has high household debt and it has been climbing further in recent years. Indeed, across the range of economies regularly tracked by the Bank of International Settlements, Australia has the second highest level of household debt, relative to nominal GDP (Chart 1). In contrast, corporate debt is about average and public debt is low by international standards.
At the outset, a key question is: why is household debt high? In Australia, high household debt reflects that: firstly, the bulk of the housing stock, including the rental properties, is owned directly by the household sector using leverage, which is not the case across many nations; and, secondly, that housing prices are fairly high when compared with household incomes.
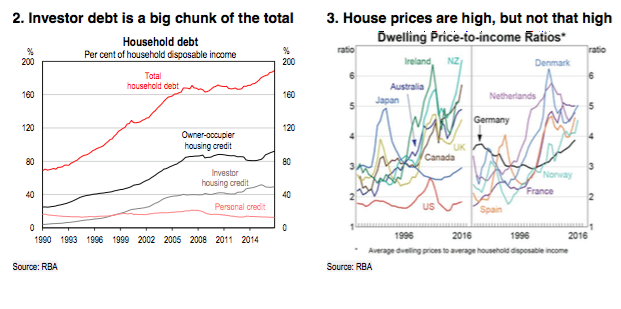
On the first point, this is because the owner-occupation rate is high, at around 68%, and because the bulk of the rental properties are also owned by the household sector directly. In Australia, investment properties, which are then rented, are a tax-favoured investment. So, unlike most other economies, including the US, for example, the stock of rental properties involves debt on the household balance sheet, rather than the corporate balance sheet. As a result, around one-quarter of Australia’s household debt is held by investors, which is a key reason that household debt levels are higher in Australia than elsewhere (Chart 2).
On the second point, Australia’s housing prices are fairly high relative to household incomes, although they are not exceptionally so (Chart 3). Australia’s housing-price to income ratio is around 5 times, which is a similar level to the UK, Ireland, Denmark, Spain, and the Netherlands.
For Australia, housing prices are high for a range of reasons, including relative economic success in the form of continued growth, low interest rates, strong population growth, and high foreign demand, in the face of limited supply.
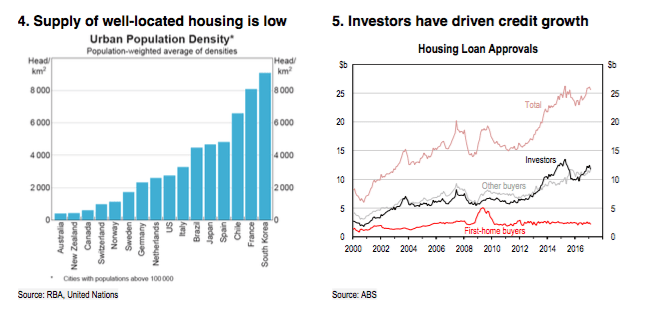
Some of these factor are cyclical, such as low interest rates, while others are structural. A key structural factor is limited housing supply. The supply of well-located housing has been limited by planning regulations and poor urban infrastructure. As a result, Australia has very low rates of urban density despite being a largely empty continent (Chart 4). Although there has been a ramp up in residential construction in recent years, in the largest city, Sydney, there is still not enough being built to meet demand (see Downunder Digest: Apartment building boom is nearing its end, 10 January 2017).
It’s the distribution of debt that matters the most
If the overall high level of household debt is driven by fundamentals, then what’s the worry? Part of the concern is that debt has been climbing recently, and that the rise has been driven by investors, rather than owner-occupiers (Chart 5). Again, even this is not worrisome, as long as the new borrowers are expected to be able to continue to service the debt. Thus it is the distribution of debt that matters the most, a point we have made before (see Downunder Digest: Australia’s rising household debt: should we worry?, 22 April 2016). The challenge is that there is considerable uncertainty about the distribution of debt and that this uncertainty rises when growth in debt is driven by new borrowers.
In Australia’s case, the key cross-sectional survey from 2014 shows quite favourable trends.
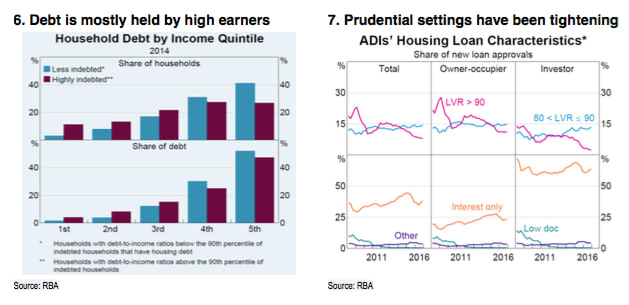
The survey shows that the bulk of the household debt is held by high-income earners, with 74% of the debt held by the top 40% of income earners. The survey also shows that most of Australia’s highly-indebted households (those with debt-to-income ratios in the top 10th percentile of debt holders) are also high-income earners (Chart 6).
Australia’s financial regulatory environment is also strong. All mortgages are full recourse and there is no sub-prime lending. Australians also have an incentive to pay down their mortgages ahead of schedule, as they cannot deduct the expenses associated with their owner-occupied housing, such as mortgage interest, against their other taxable income. As a result, the average mortgage holder is around 21⁄2 years ahead on their mortgage payments (when offset accounts and redraw facilities are included). This means that the average borrower has a significant buffer on which to draw in the event of job loss or some other negative income shock.
So what is the concern? First, the information on the distribution of debt is from 2014 and we know that household debt has risen since then. We do not know much about the distribution of the new debt, although we do know that the bulk of it has been for property investors. On the positive side, historically, investors have been less likely to default on mortgages than first home buyers as investors tend to have equity in an owner-occupied property, and tend to be older and higher-income households with a loan repayment history. On the negative side, we do not know much about the new investors in recent years, although we know that the prudential regulator has been tightening its settings since late 2014 to prevent an excessive build-up of risk.
Second, although the average mortgage holder has a significant buffer, it is not the average borrower that typically defaults. At the riskier end of the spectrum of borrowers there is evidence of mortgage holders with only slim buffers against a negative income shock. For example, in a recent speech (4 May 2017), the RBA Governor, Mr. Phil Lowe, referred to data on securitised loans which showed that about one-third of borrowers only have a one-month buffer.
However, in that same speech Governor Lowe relayed that the RBA’s own assessment, with full access to all of the granular lending numbers, was that the risk of rising household debt levels was not to financial stability but to the macroeconomic cycle. Given that lending standards have been tightened and that risky loans are still only a small share of financial system liabilities, a large enough rise in loan defaults to shake the overall financial system is unlikely.
What happens when housing price growth slows?
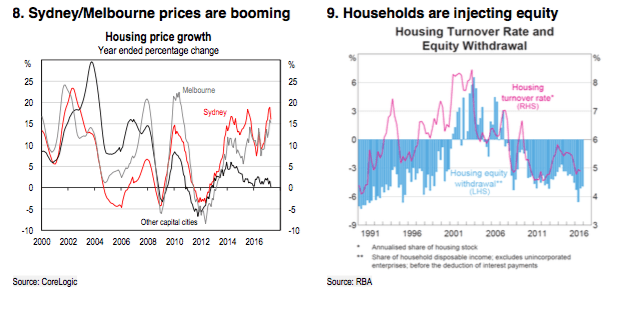
The RBA’s concern is that, when housing price and household credit growth slow down, this could exacerbate the economic cycle. Sydney and Melbourne have had significant housing prices booms in recent years, although it has been quite concentrated to these cities (Chart 8).
Sydney and Melbourne housing prices have risen 77 percent and 58 percent over the past five years, while housing prices are only 14 percent higher in the rest of the nation.
The RBA’s argument is that the eventual slowdown, or fall, in housing prices and easing in the pace of household credit growth could weaken overall economic growth, particularly growth in household consumption.
While a slowdown in housing activity would, no doubt, have some effect, it may not be as large as in the past. Indeed, there is clear evidence that the recent ramp up in housing prices and household debt has had little impact on households’ willingness to borrow to consume goods and services. Unlike the early 2000s housing boom, households have not been withdrawing equity from their properties, but rather have been injecting it in recent years (Chart 9). If there has not been a significant positive wealth effect from rising housing prices and household debt, any slowdown in these factors may also have a more muted effect than in the past.
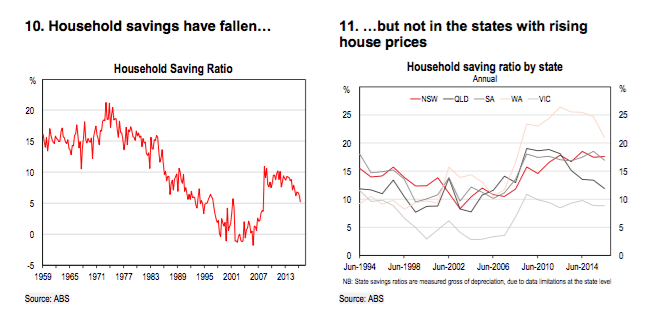
A key counter-argument is that the household saving rate has been falling in recent years, which provides some evidence of a positive wealth effect (Chart 10). That is, households may have been more willing to lower their saving out of income because their wealth has been rising.
However, the state-level numbers suggest that this story is a bit more nuanced. The biggest fall in the saving rate has occurred in Western Australia, following a sharp rise earlier. This reflects the impact of the mining boom, which boosted incomes significantly in that state prior to 2011/12 and where incomes have fallen since. Western Australian households saved when income growth was strong and have been saving less recently, in line with what a permanent income model might suggest.
However, the saving rate has not moved much in New South Wales and Victoria, where the housing markets have been booming recently. This suggests that the wealth effect has, in fact, been quite small in these states, consistent with the housing equity withdrawal numbers.
In our view, when the housing markets in Sydney and Melbourne cool, which we expect to be the case this year and next, we do not expect a large negative wealth effect.
For the RBA, the idea of the overall economic cycle being exacerbated by the housing cycle is clearly a concern. In our view this concern would suggest an earlier tightening, rather than a later one, though. If the concern is not allowing the housing boom to continue too long, because the end of the boom could cause problems, the risk-averse approach is likely to be higher rates, not lower ones.
PAUL BLOXHAM IS CHIEF ECONOMIST (AUSTRALIA AND NEW ZEALAND) FOR HSBC.